
In response to the challenges of high-dimensional data overfitting, difficulty in adapting to dynamic rules, and insufficient quantification of key factors in Olympic medal prediction, this paper proposes a hybrid prediction framework integrating Graph Neural Networks, Random Forest, and dynamic causal analysis. The core innovations of the framework include: the first two-stage feature screening mechanism, i.e., domain knowledge preliminary screening + Random Forest importance ranking mechanism; constructing a national competition relationship graph, extracting embedded features through Graph Neural Networks to drive multi-output Random Forest regression for predicting medal distribution; and innovatively combining OLS regression with CUSUM control charts to achieve static quantification and dynamic jump detection of the "elite coach effect". Experiments based on Olympic data from 1896 to 2024 show that the model's prediction R² reaches 0.9634, an 18% improvement over traditional models, and it can accurately identify emerging medal-winning countries and strategic intervention windows. This framework provides interpretable decision support for the Olympic Organizing Committee in resource allocation, coach recruitment, and event planning.
The Olympic Games, hosted by the International Olympic Committee, are the largest comprehensive sports events in the world and the most influential sporting extravaganza, whose gold medal value is self-evident [1]. With the commercialization and technologicalization of global sports competitions, Olympic medal prediction has become an interdisciplinary hotspot in sports management and socioeconomic research. Accurate prediction of medal distribution can not only provide a basis for national Olympic committees to allocate strategic resources, but also reveal the complex relationship between sports achievements and social factors. For example, in the 2024 Paris Olympics, emerging countries such as Saint Lucia won medals for the first time, highlighting the necessity for models to capture dynamic pattern changes [2]. By modeling and analyzing medal trends, it is possible to quantify the effects of policies, identify potential countries, and provide data-driven decision support for sports development strategies. In addition, accurate medal predictions can help event organizers estimate the attention and intensity of competition for each event. According to the medal prediction results, organizers can plan publicity strategies in advance. At the same time, athletes and coaches can understand the strength of competitors and their advantageous events based on medal predictions, and set clear goals for athletes.
In response to the increasing complexity of the Olympic competitive landscape and the diversified needs of national sports strategic decision-making, this study aims to construct a comprehensive, dynamic, and interpretable medal prediction and analysis framework. It can not only accurately predict the medal distribution and confidence intervals of various countries in the 2028 Los Angeles Olympics [3], but also further identify which countries may rise or decline in future Olympics, and explore the potential paths of countries that win medals for the first time. On this basis, the model will quantify the systematic impact of Olympic event settings and host country selection on the medal structure, and integrate the "great coach effect" evaluation mechanism to capture the marginal contribution of key human factors to competitive leaps [4]. Finally, the model is not only used for prediction, but also provides data-driven strategic suggestions for NOC in event planning, resource investment, and coach configuration through an interpretable mechanism.
At present, there are many methods for medal prediction, which can be roughly divided into three categories: physical methods, statistical methods and artificial intelligence-based methods. Physical methods usually refer to models based on dynamic trends and competition mechanisms. For example, time series models are used to predict medal trends, and the number of medals is regarded as a dynamic process evolving over time. Typical practices include using the Autoregressive Moving Average Model (ARIMA) to capture periodic fluctuations [5] or the grey prediction model to describe the development trend of the number of medals [5]. The advantage of this kind of method is that it can use historical data to find periodic laws, and the model is relatively simple; however, its limitation is that it does not fully consider the external factors affecting medals, and it is difficult to cope with sudden changes in national strength or the emergence of new sports powers. The statistical method refers to an empirical model based on macro-statistical correlation. Studies have found that a country's per capita economic strength, population size, host effect, etc., have a significant impact on the total number of medals [6]. For example, Bernard, Busse and others established a medal prediction model through multiple regression, proving that GDP, population and host country status have a significant positive effect on the total number of medals [5]; Johnson and Ali's research further quantified the effect of the host country's advantage on the substantial increase in the number of medals [6]. The advantage of the statistical model is that it is highly interpretable and can clarify the contribution of various factors; however, the limitation is that most of the models assume a linear relationship, which is difficult to describe complex nonlinearities, and lacks flexibility for abnormal events such as political factors and suspensions.
To overcome the limitations of physical and statistical methods, artificial intelligence-based medal prediction methods have been proposed and received extensive attention. AI methods use machine learning and complex models to capture patterns from massive data. In recent years, many AI prediction models have emerged, ranging from traditional neural networks to deep learning and graph algorithms. Early studies combined nonlinear regression with BP neural networks to improve prediction accuracy [5]. Nowadays, advanced models integrating spatiotemporal information have emerged. For example, Wang et al. proposed a Spatiotemporal Graph Convolutional Network-Long Short-Term Memory model (STGCN-LSTM), which uses the geopolitical relationships between countries, coach mobility, etc., as a graph structure, and combines the time dependence of historical performance and economic data to predict medal distribution through deep learning [7]. The advantage of such AI models lies in their ability to characterize highly nonlinear relationships and integrate multi-source data, which can improve accuracy and reveal implicit patterns [7]. In recent years, technological breakthroughs in this field have further expanded the application boundaries of AI models: In 2025, Bhavya Vasudeva et al. discovered in their research on the Transformer architecture that it inherently possesses the ability to learn "low-sensitivity functions". Its robustness to minor input changes and cross-scenario generalization are significantly superior to those of traditional deep learning models [8], which provides a new architectural approach for medal prediction. During the same period, the "In-Run Data Shapley" method proposed by Jiachen T. Wang et al. can accurately measure the contribution of each sample (such as the data of a country in a certain Olympic Games) to the prediction result in a single model training process [9], offering a quantitative tool for subsequent screening of effective Olympic data and reduction of interference from redundant features.Despite the remarkable achievements of artificial intelligence-based medal prediction methods, two major challenges remain. On the one hand, Olympic data contains high-dimensional sparse features from 197 countries across more than 200 events, making models prone to overfitting and less interpretable [10]. Meanwhile, changes in competition rules require a dynamic feature update mechanism [11]. To address this, a two-stage feature screening paradigm can be designed to filter out invalid features. This challenge has seen targeted breakthroughs in recent machine learning research: The LLM fine-tuning tracking method proposed by Yi Ren and Danica Sutherland in 2025, though focused on language models, offers a new perspective for identifying key features that change with adjustments to competition rules, thanks to its core idea of "quantifying changes in word probabilities" [12]. Current research includes an evolutionary multi-task based two-stage feature selection method, which consists of two stages. The first is the classification task construction stage, where feature data is obtained, different features are formed into corresponding feature subsets, and stored in a feature database. All feature subsets in the database are retrieved to determine the initial feature subset (denoted as Task 1), and all sorted feature subsets are denoted as Task 2. The second stage is the optimal feature screening stage, where for Task 1 and Task 2, the particle swarm algorithm in evolutionary multi-task methods is used to find the optimal feature subset that matches the preset search conditions and output it [13].
On the other hand, machine learning models are often regarded as "black boxes", making it difficult to quantify the marginal contributions of key factors such as coaches and the number of events, thus limiting their guiding value for policy formulation [14]. A method combining Ordinary Least Squares (OLS) regression with Cumulative Sum (CUSUM) control charts is proposed to solve this problem for quantifying dynamic causal effects. OLS is a linear regression model that estimates model parameters by minimizing the sum of squared residuals between the observed and predicted values of the dependent variable [15]. In this paper, the average contribution of "great coaches" to the number of medals is estimated by minimizing the residual sum of squares (RSS). The regression coefficients are solved via matrix operations, while other interferences are excluded through variable control. To identify whether a significant performance improvement occurs after a coach assumes office, the CUSUM model is introduced in this study to detect mean mutation points in time series data. Performance "jumps" or continuous changes are identified through the analysis of cumulative deviations [16]. The combination of OLS and CUSUM forms a complete framework of "static analysis + dynamic verification", providing a basis for predicting Olympic medals and optimizing coach resources.
In response to the above challenges, this paper constructs a hybrid framework integrating graph neural networks, random forests, and dynamic causal analysis.The construction of this hybrid framework fully draws on key breakthroughs in the field of machine learning in recent years: The SAM 2 model proposed by Nikhila Ravi et al. extends the capability of static image segmentation to dynamic video streams, and its technical logic of "real-time tracking of moving targets" provides a cross-modal modeling reference for this study [17]. The core contributions are as follows:
1) Addressing the difficulty in effectively modeling the sports competition landscape among countries, graph neural networks (GNN) are introduced to characterize the sports competition relationships among countries and extract relationship embedding features.
2) Aiming at the robustness and interpretability requirements of sports event medal count prediction, a random forest ensemble learning model is adopted, and the extracted relationship embedding features are used for regression prediction, achieving a robust improvement in prediction performance and enhancing model interpretability.
3) Focusing on the problem that the contribution of specific strategic factors (such as the "famous coach effect") to medal improvement is difficult to quantitatively evaluate, a dynamic causal analysis method is introduced to realize the quantitative analysis of the impact of such key factors.
Figure 1 presents the causal forest framework for the analysis of dynamic competitive technology representation. This framework consists of a data pre-processing layer, a characteristic process layer, a mixed pre-measurement layer, and a strategy generation layer. In the third part of this document, you will find a comprehensive explanation of the detailed methods that are to be followed. Each method will be broken down into its individual components, with clear descriptions and, where necessary, visual aids such as diagrams or flowcharts to further illustrate the points being made.
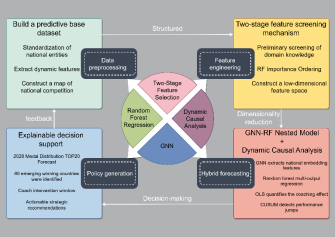
Figure 1. Graph-causal forest prediction framework
2.1. Data Preprocessing Layer
This layer integrates historical medal, economic, and athlete data. Core tasks include entity alignment and dynamic feature construction. Temporal features , event features, and coach features are extracted. Additionally, a graph structure is built among countries using GNN to represent competitive relationships.
2.2. Feature Engineering Layer
This layer is divided into two stages. In the first stage, domain knowledge is used to exclude 60 non-medal-winning countries, retaining 137 active countries while calculating feature correlation to filter out redundant dimensions by removing indicators with excessively low correlation to medal counts. In the second stage, random forest's feature importance ranking is utilized to identify core features such as historical medal counts, athlete numbers, and event compatibility, constructing a low-dimensional feature space.
2.3. Hybrid Prediction Layer
This layer is the focus of this paper. During the modeling phase, the study proceeds along two parallel tracks: the development of a medal count prediction model and the analysis of influencing factors. For medal prediction, a combined GNN and Random Forest model is constructed. Each Olympic Games is regarded as a graph, with nodes representing participating countries. The GNN is used to extract the hidden feature vectors of each country, and the Random Forest regression [18] is employed to predict the country's medal counts, including gold, silver, bronze, and total medals. The analysis of influencing factors specifically targets the "Famous Coach Effect", which refers to the impact of recruiting renowned coaches on medal outcomes across different national teams. Methods such as CUSUM are used to detect the "flat" sequences of certain countries without medals in specific events for a long time, and to evaluate the potential performance improvement brought by introducing famous coaches.
2.4. Strategy Generation Layer
This processing layer serves as the central component of decision support and directly receives comprehensive output data from the upstream "hybrid prediction layer". The input data are extensive, encompassing not only quantitative predictions regarding the probability of medal distribution among countries or athletes in future events, but also critical information such as recommendations for optimal coach recruitment timing and target candidate analysis derived from the talent supply and demand model—referred to as the "Coach Recruitment Window"—as well as strategic investment value assessments and risk evaluation reports across various events and sports disciplines.
The primary function of this layer is to integrate, analyze, and prioritize these diverse predictive inputs, transforming them into actionable intelligence that can directly inform senior management decision-making.
3.1. Data and Graph Model Construction
This phase is implemented at the data preprocessing and feature engineering level. First, the data is preprocessed to handle outliers and missing values, and the feature variables are standardized.
The random forest algorithm is used to rank feature importance. For the application of graph neural networks, a graph structure is constructed for each Olympic Games, in which the node set represents the participating countries. The node features are selected as the medal vector of each country in that edition of the Games. The edge set is used to characterize the competitive relationships and similarities between countries. To address the scarcity of direct data on inter-country relationships, an innovative fully connected graph structure is employed, wherein edge weights are assigned based on the similarity of medal performance: the connection between nodes i and j is strengthened as the difference in their total medal counts decreases. This ensures that countries with similar performance exert greater influence on each other during graph convolution, implicitly simulating the hierarchical structure of the competitive landscape—e.g., traditional powerhouses influencing each other, while weaker nations do the same. The subsequent section elaborates on the graph structure construction and the definition of edge features.
A fully connected graph representation is constructed for each Olympic Games, with edges connecting all possible pairs of country nodes. The edge strength, or weight, reflects the similarity in medal performance between the two countries.
Definition of edge weights for the degree of similarity in grades:
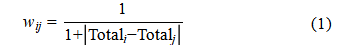
Formula(1) ensures that countries with similar medal counts have stronger connections, reflecting the real-world logic of "similar competitive levels → greater mutual influence."
In addition, formula(1) constructs a symmetric adjacency matrix to ensure propagation consistency during GNN convolution, while establishing stronger connections between countries with similar medal counts—a design that reflects the real-world logic of "similar competitive levels lead to greater mutual influence." Through graph neural network training, each country node ultimately obtains a 32-dimensional graph embedding feature vector that comprehensively captures its competitive state, including historical medal performance, competitive similarity with other nations, and potential sports strength relationships. These graph-derived embeddings serve as critical input features for the subsequent random forest model, significantly enhancing the model's discriminative capacity by encoding both a nation's intrinsic attributes and its relational dynamics within the global sports competition network.
3.2. Hybrid Prediction Modeling Phase
3.2.1. Graph Neural Network Model
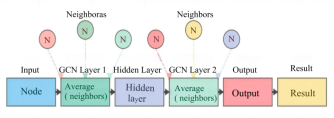
Figure 2. Graph convolutional network layers
This study utilizes a two-layer Graph Convolutional Network (GCN) to extract hidden features from country nodes. The specific results of the graph convolutional network are shown in Figure 2. Specifically, the first convolutional layer maps the initial medal features of each country to a 32-dimensional hidden representation, while the second convolutional layer further transforms the hidden representation into an output representation. The propagation mechanism of GCN enables each node to aggregate features from adjacent nodes (i.e., other countries), weighted by the aforementioned edge weights, thereby capturing the competitive-level correlations among countries.
Formally, the first-layer update is:
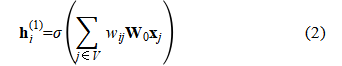
the second-layer update is:
where  represents the input features of country
  ,
,  and
and  are learnable weights, and
  is the ReLU activation function. It should be noted that we set the output dimension of the second GCN layer to 1 and used the gold medal counts of each country as the training target to supervise GCN training. The rationale behind this is that by enabling the GCN to approximate the gold medal distribution across countries, it will automatically learn hidden-layer feature representations h that distinguish between strong and weak countries. A K-fold cross-validation procedure was implemented during training, partitioning the historical Olympic graph data such that graphs from certain years were allocated for GCN training. The loss function employed mean squared error (MSE) to measure the discrepancy between predicted and actual gold medals, optimizing the GCN parameters accordingly.
3.2.2. K-Fold Cross-Validation
This study adopted the 5-fold cross-validation method. The 5-fold cross-validation used is shown in Figure 3.Specifically, the year-based graph data was partitioned into 5 folds, with 4 folds used for GNN training and embedding extraction, and the remaining 1 fold reserved for testing. In each fold, the graph embeddings of each country node were extracted as features, and a multi-output random forest model was employed to jointly predict total medals, gold, silver, and bronze medals.
3.2.3. Random Forest Regression
After the completion of GCN training, a 32-dimensional hidden feature vector is obtained for each country in each Olympic Games. This vector, which corresponds to the output of the first GCN layer, functions as the country embedding. These features are then used to train a random forest regression model to simultaneously predict each country's total medals, gold medals, silver medals, and bronze medals.
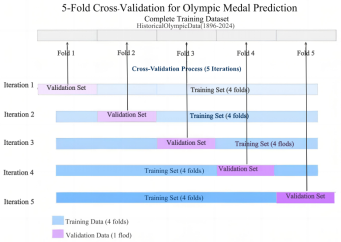
Figure 3. 5-fold cross-validation
In the implementation, a multi-output regressor encapsulating a random forest is employed. This ensemble comprises 100 regression decision trees, which collectively facilitate the simultaneous prediction of multiple target variables. The random forest enhances generalization performance through ensemble learning and leverages decision tree splits to capture nonlinear relationships between features and medal counts [19].
The random forest algorithm was selected for its robustness and interpretability, as it delivers stable predictions even with correlated or noisy features, while simultaneously enabling feature importance evaluation to analyze which GCN-extracted latent features contribute most significantly to the predictions.
The Random Forest regression model captures non-linear relationships between historical medal data and external factors by aggregating predictions from multiple decision trees, forecasting 2028 Olympic gold and total medals. Key feature variables include:
· Historical performance data: the number of gold medals( ), the total number of medals(
 ) and the number of silver medals(
 );
);
· Sports resources and inputs: number of athletes( ), training funds(
 ), sports facilities index(
 );
);
· Programme setup characteristics: total number of programmes( ), proportion of tra ditionally dominant programmes(
 ), number of new programmes(
 );
);
· Host country strategy: host country preference( , dummy variable coded as 0 or 1).
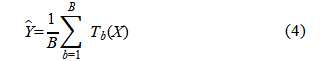
The model obtains the final output by constructing B decision trees(default B=100) and averaging the predicted values of each tree:
3.2.4. OLS Regression and CUSUM
Multiple linear regression is employed to analyze the impact of event quantity, event type, and host country strategies on medal distribution.This approach provides a clear and transparent way to reveal linear causal relationships. Its interpretability, maturity, and complementary role alongside other models make it an ideal tool for examining the influence of event settings and coaching strategies.
While it may require integration with nonlinear models for complex data, its role in causal inference and policy guidanceremains irreplaceable.

In formula(5), Y is the dependent variable representing the predicted medal count. β0 is the intercept term, indicating the baseline medal count when all independent variables are zero. 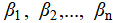 are regression coefficients reflecting the degree of influence each independent variable has on the medal count.
  are independent variables representing the event-specific characteristics affecting medal distribution.
  is the random error term, accounting for unexplained random fluctuations in the model.
The quantification of coaching influence employs a mixed modeling methodology that combines ordinary least squares regression—analyzing associations between coaches and medal outcomes while calculating marginal effects per event—with CUSUM control charts for detecting significant athlete performance improvements. The selection of this mixed approach facilitates the integration of static quantification with dynamic monitoring, thereby providing comprehensive numerical evidence of coaching impact alongside real-time tracking of effect variations [20]. This method ensures analytical depth and breadth, offering sports administrators a comprehensive, reliable tool for evaluating coaching value and optimizing resource allocation.
Formula(6) is the OLS Regression Model Formulas:
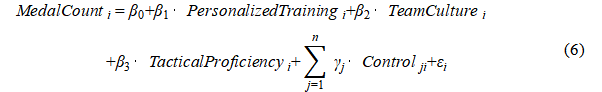
·  is the dependent variable, representing the medal count of the i-th country or athlete.
·  is the intercept term, indicating the baseline medal count when all independent variables are zero.
·  measures the marginal effect of personalized training on medal count—i.e., the expected change in medals per one-unit improvement in training quality.
·  measures the marginal effect of team culture on medal count—e.g., the expected change in medals per one-unit increase in team cohesion.
·  measures the marginal effect of tactical proficiency on medal count—e.g., the expected change in medals per one-unit improvement in tactical skill.
·  represents the coefficient of the j-th control variable, reflecting its influence on medal count.
·  is the j-th control variable for the i-th sample.
·  is the random error term, capturing factors not explained by the model.
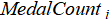
Formula (7) and formula (8) are the CUSUM Control Chart Formulas:
·  is the positive cumulative sum statistic, reflecting the extent to which medal counts persistently exceed the baseline.
·  is the negative cumulative sum statistic, reflecting the extent to which medal counts persistently fall below the baseline.
·  is the actual medal count in
  .
.
·  is the baseline medal count (e.g., the average medal count before the coach's tenure).
· k is the control limit width, typically set to half of the residual standard deviation.
· t is the time period (e.g., Olympic edition or season).
4.1. Preparation
4.1.1. Dataset
The dataset used in this study was sourced from the official Olympic historical data provided for Problem C of the 2025 American College Student Mathematical Contest in Modeling (MCM). It covers multidimensional information from the Summer Olympics held between 1896 and 2024, including medal distributions, athlete participation, event structures, and host city details. The primary data tables consist of national medal records, athlete profiles, competition format evolution, and host country information, forming a structured database with country-year dual indexing.
After standardized cleaning and relational integration of multiple subtables, key variables were extracted, such as gold/silver/bronze medal counts, participant numbers, event participation counts, total event numbers, and host country status. These were further organized into a unified "Country × Year × Feature" input tensor, providing high-quality data support for multi-task prediction and structural modeling.
4.1.2. Data Processing and Feature Selection
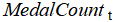
The data processing phase initiated with data integration and preprocessing operations to ensure dataset consistency and completeness. Subsequent steps included standardizing historical medal data, socioeconomic indicators, and athlete records to address entity disambiguation challenges. Particular attention was given to normalizing all relevant data affected by country name changes (e.g., the merger of FRG/GDR into GER), facilitating seamless integration across historical datasets. The comparison of the changes in the historical names of the participating units and the number of MEDALS won by each country are shown in Table 1 and Figure 4 respectively. The core objective of this step is to achieve entity alignment across all categories, eliminating data biases caused by naming discrepancies and thereby enhancing the accuracy of subsequent analyses.
Table 1. Comparison of Historical Name Changes of Participating Entities
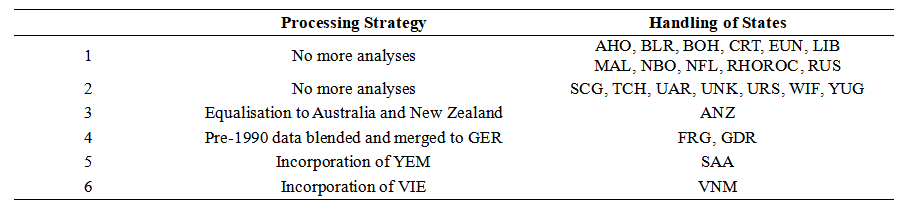
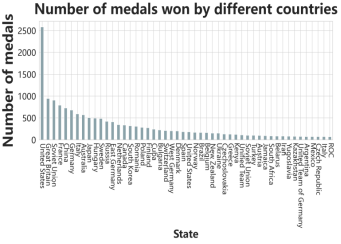
Figure 4. Number of medals won by different countries
Another key task in data preprocessing was extracting temporal and dynamic features to capture national performance changes across Olympic cycles. The analysis incorporated medal trends derived from the previous three Olympic Games, along with cross-period performance evaluations for each country. Additionally, event-specific characteristics were integrated, comprising: (1) the proportion of dominant events per nation, and (2) compatibility metrics with newly added events. To enhance the representation of coaching influences, coaching tenure duration and historical medal improvement rates were incorporated. These components collectively established a dynamic feature framework for tracking longitudinal competitive performance trends across nations.
During feature engineering, 137 active nations were initially selected through domain expertise while excluding 60 non-medal-winning countries. Correlations between each feature and medal counts were computed, with weakly correlated features eliminated to prevent redundant information from interfering with model performance. To further refine the feature space, random forest algorithms were applied to rank feature importance [21], identifying the most influential predictors including historical medal counts, athlete participation numbers, and event compatibility metrics, as illustrated in Figure 5. This enabled construction of a streamlined low-dimensional feature space to simplify subsequent modeling. Continuous variables (e.g., event quantities) underwent normalization while categorical variables (e.g., event types) received one-hot encoding. The analysis of medal change rates throughout coaching tenures was undertaken using four-year Olympic cycles as the temporal framework. A comparative baseline was established by calculating the mean medal tally from the three Games immediately prior to each coach's appointment.
Figure 5. Comprehensive feature importance for olympic medal prediction
To incorporate the potential influence of international competitive relationships and national similarities, a Graph Neural Network (GNN) was employed to model and integrate relational features among countries into the medal prediction model. The GNN model effectively captures interactions and similarities between nations, using each country's medal vector in specific Olympic Games as edge sets to characterize the competitive landscape. The national competition relationship diagram is shown in Figure 6. This approach not only enhances feature representation capability but also improves the model's predictive accuracy.
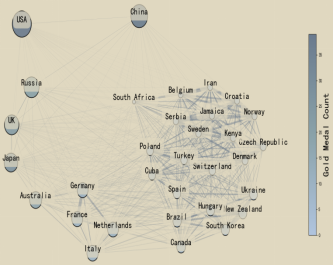
Figure 6. National competition relationship graph based on medal similarity
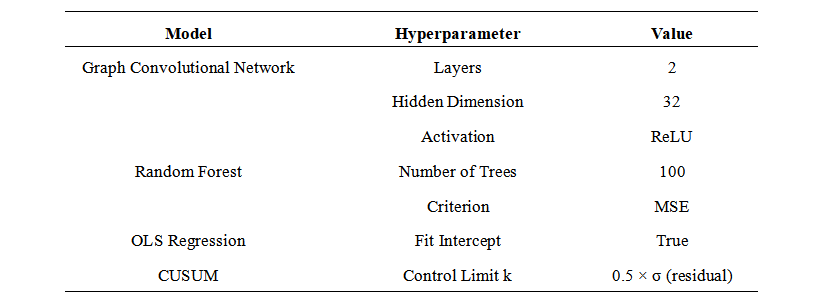
4.1.3. Hyperparameter Settings
Key hyperparameters for each model component are listed in Table 2.
Table 2. Hyperparameter settings for model training
4.1.4. Performance Evaluation Metrics
i. Parameter estimation methods
Ordinary Least Squares (OLS) was used to estimate the regression coefficients with an objective function of minimising the residual sum of squares (RSS):
Minimization of the aforementioned objective function enables the estimation of regression coefficients  .
.
Solving regular equations via matrix form:
· Total number of events ( ): for each additional event, the expected number of medals increases by
  ;
;
· Number of new projects ( ): change in projected number of medals by
  for each additional emerging sport;
· Host country preference ( ): the host country is expected to win more medals.
ii. Indicators for model evaluation:
· Coefficient of determination ( ): a measure of the proportion of variation explained by the model:
· Mean Square Error ( ): quantifies the deviation of the predicted value from the actual value:
· Regression coefficient significance test: t-test to verify whether the effect of each variable on the number of medals is significant ( )
)
These evaluation metrics allow us to judge the predictive effectiveness of the regression model and further optimise the model to ensure that it is suitable for predicting the number of gold medals and the total number of medals for each country in 2028.
4.2. Hybrid forecasting
4.2.1. Medal Count Prediction
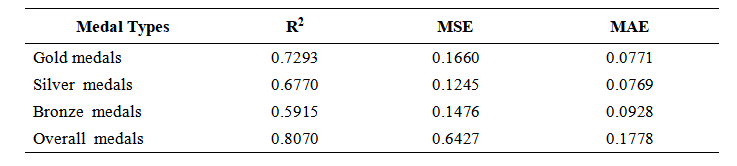
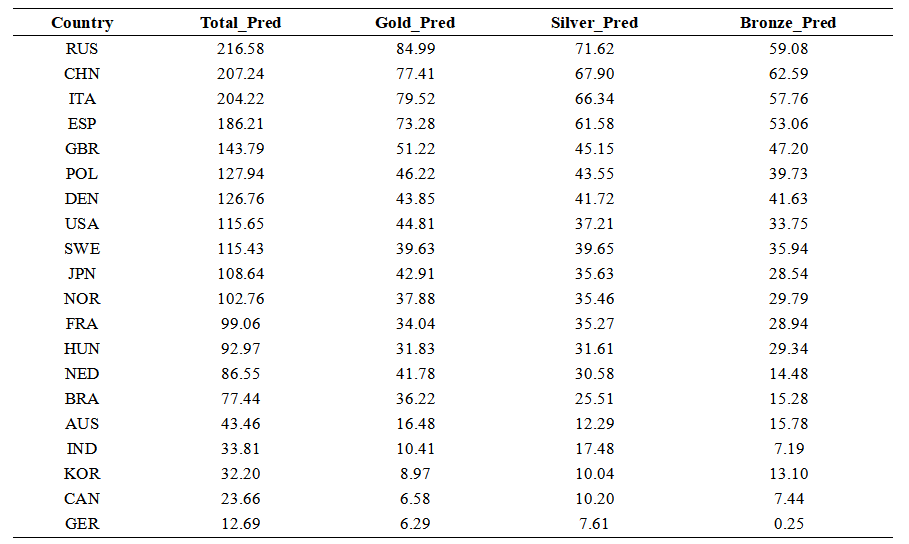
The adopted method consisted of first generating predictions for each scheduled event independently, followed by a collective statistical analysis of all events. Let's take football as an example below. To predict medal counts for nations in the 2028 Olympic football program, a 5-fold cross-validation approach was employed, wherein the original dataset was equally divided into five parts. Each iteration used one part as the test set while the remaining four served as training data, repeating this process five times with different test sets to calculate the average accuracy as the final reference for model performance. To predict competition outcomes, three-year historical data features were processed using a random forest regression algorithm to generate averaged inputs for the prediction model. The predicted medal numbers for the 2028 national football championships are shown in Table 3. This method achieved stable prediction accuracy while effectively capturing football-specific competitive patterns. The evaluation indicators are shown in Table 4.
Table 3. Forecast of the number of medals in FOOTBALL programme for all countries in 2028
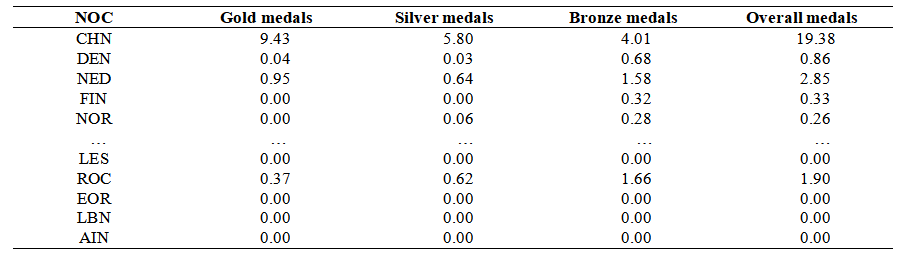
Table 4. Evaluation index
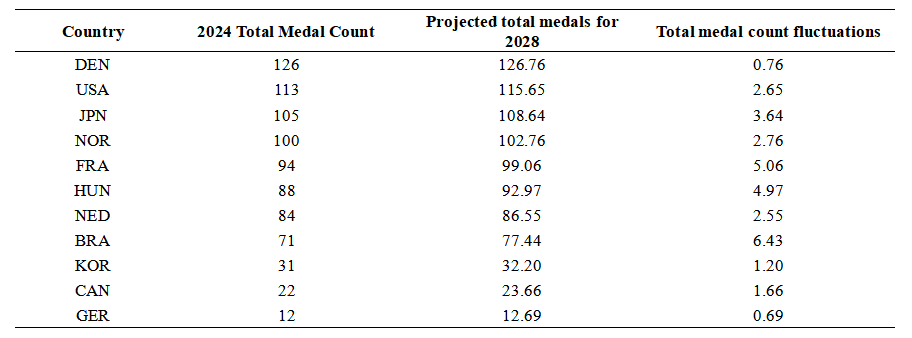
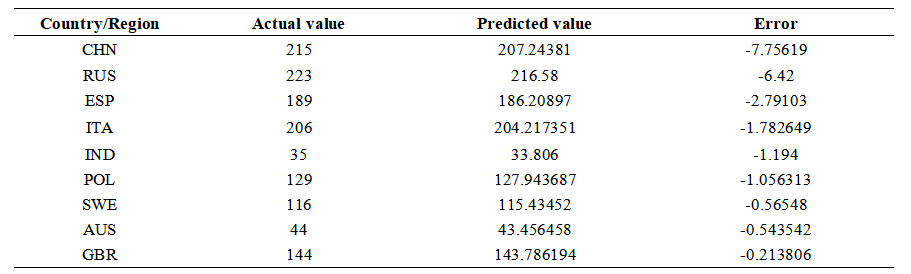
The predictions for each race are built in turn according to the above method, and then summed up and predicted with 95% prediction intervals, resulting in predictions that include the prediction intervals (Table 5 only shows some of the prediction results). Tables 6 and 7 respectively present the prediction results of advancing and retreating countries.
Table 5. The medal counts for the 2028 Olympics TOP 20:
Number of progressing nations (with total medal increase): 11
Table 6. List of progressing nations:
Number of regressing nations (with total medal decrease): 9
Table 7. List of Regressing Nations
· Prediction of Significantly Progressing Countries in 2028 (Change > 5): BRA, FRA
· Prediction of Significantly Regressing Countries in 2028 (Change < -5):CHN, RUS
· The countries that will receive their first medals are:
ARM,COL,JAM,MEX,IRI,...,PAN,PHI,SUI,PRK,SLO and 68 other countries.
4.2.2. Analysis of Influencing Factors
This paper explores the impacts of Olympic event setup and the "Great Coach Effect" on medal distribution, providing decision-making references for the International Olympic Committee (IOC) based on the established models.
The analysis of Olympic event programming's influence on medal distribution utilized a multiple linear regression model. This model assessed the contributions of various factors, including the number of events, event types, and host nation strategies. Subsequent data processing involved the classification and aggregation of medal-related features to establish predictive characteristics, such as the total number of events and newly added events, as illustrated in Figure 7.
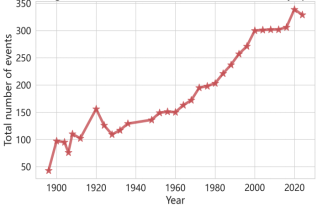
Figure 7. Total number of events
Subsequently, the relationship between different events and their impacts across countries was analyzed using correlation heatmaps (Figure 8). Owing to data sparsity—with most countries winning no medals in the majority of events—an initial filtering step was applied to identify nations with high medal counts. Following the visualization of these countries via heatmaps, correlation analyses were conducted based on randomly selected matching results, which subsequently served as inputs for model fitting.
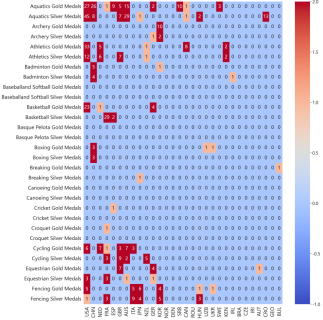
Figure 8. Correlation heatmap
Finally, the relationship between the number of medals and event characteristics was modeled using linear regression analysis, which produced the fitted result shown in Figure 9.
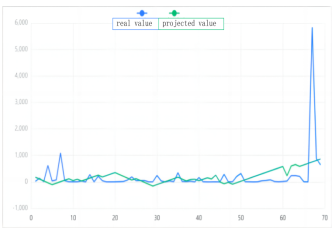
Figure 9. The fitting graph depicting the relationship between the number of medals and event characteristics
From the above Figure 9, it can be seen that the analysis of Olympic event medals based on the multiple linear regression model is highly consistent with the actual medal count, but there are still unavoidable errors. These errors are mainly caused by differences between the model and the actual system, as well as environmental interference. Given that the mathematical model obtained through system identification is basically consistent with the actual system step response curve, this model can be used to analyze the impact of Olympic event setup on medal counts.
In evaluating the impact of the "Great Coach Effect" on medal outcomes, an OLS regression analysis was employed to quantify its influence, while a CUSUM model was innovatively applied to detect performance "jump points". The combination of these methods forms an integrated analytical framework characterized by "static analysis + dynamic verification". During data processing, coach and athlete information was integrated to establish linkages between coaching figures and medal results. Missing and anomalous data were handled through measures such as interpolation imputation or the exclusion of samples with excessively high missing rates, thereby ensuring greater accuracy in coach performance assessment.
Subsequently, a subset of the data was selected to generate medal trend visualizations.The results of the influence of coaches on the winning situations of volleyball in China and the United States, as well as women's gymnastics in Romania and the United States, are shown in Figures 10-13.
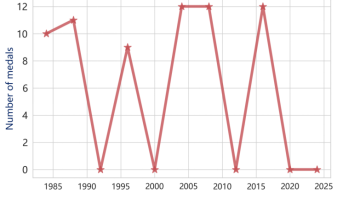
Figure 10. The changes in medals won by Chinese volleyball teams
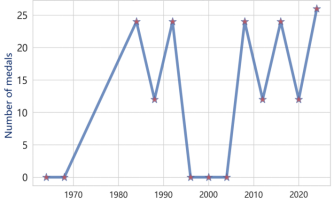
Figure 11. The changes in medals won by the US volleyball teams
Finally, an OLS regression model was constructed for each data group to assess the influence of coaches through analysis of P-values and regression coefficients. The influence of renowned teachers on the above four national projects is shown in Figure 14. The CUSUM model can detect performance stagnation periods; countries with stagnation of ≥3 years are marked for recruiting elite coaches to promote progress. During modeling, the analysis was restricted to coaches at the national level and did not extend to specific sports or individual coach–athlete pairings, which introduced inherent limitations to the accuracy of the results. However, given that the core goal is to provide national-level resource allocation recommendations rather than micro-individual analysis, the model is considered applicable for analyzing the impact of the "Great Coach Effect" on medal counts.
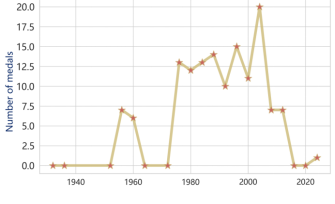
Figure 12. The changes in medals won by Romanian gymnastics
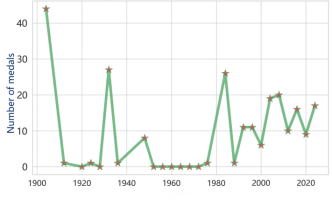
Figure 13. The changes in medals won by the US gymnastics
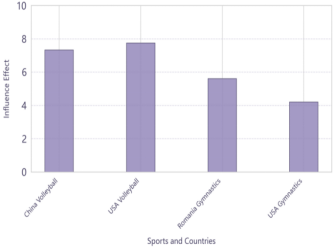
Figure 14. The influence of renowned teachers on projects in various countries
4.3. Performance Analysis
k-Fold Cross-Validation in Olympic Medal Prediction:
The performance is specifically presented in Figure 15 and Table 8. Figure 16 is a further visualization of Table 8.
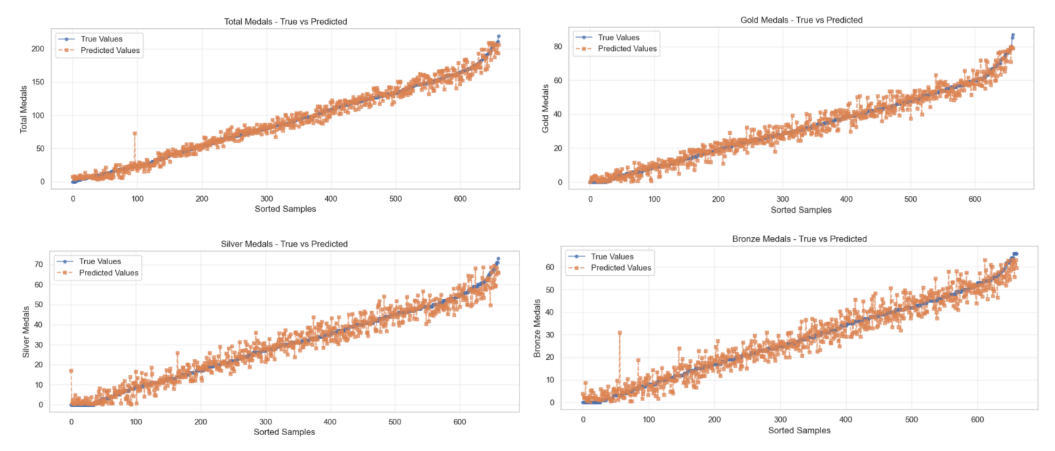
Figure 15. Scatter plot comparison of predicted vs. actual medal counts
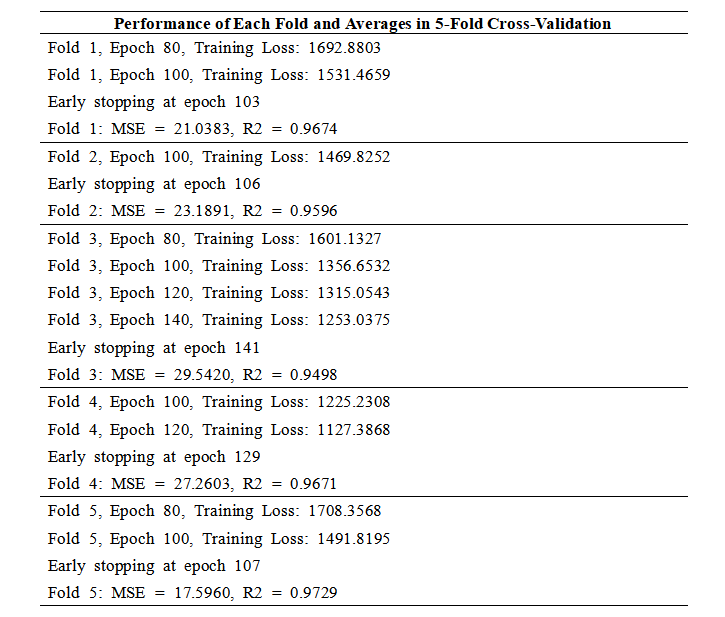
Table 8. Performance of each fold and averages in 5-fold cross-validation
Average MSE: 23.7251, Average R2: 0.9634
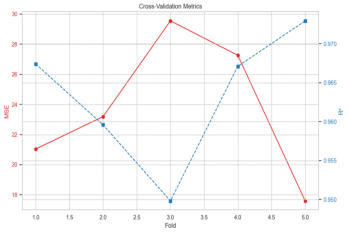
Figure 16. Performance of per fold
The graph-causal forest prediction framework developed in this study demonstrates robust performance in enhancing the accuracy and interpretability of Olympic medal forecasts. However, several limitations remain, warranting further investigation and refinement in future research.
Firstly, regarding graph structure modeling, this study constructs a fully connected graph based on medal similarity to represent inter-national competitive relationships. While this approach offers advantages such as model simplicity and symmetry, it does not sufficiently account for complex factors influencing competition dynamics, including geographical proximity, sports collaboration intensity, and historical cultural ties. Although this simplification facilitates computation, it may constrain the model's capacity to capture deeper features of inter-national competition and cooperation.
Secondly, the model's characterization of temporal dynamic features remains inadequate. Despite incorporating temporal statistical measures such as historical medal trends during feature engineering, the random forest model inherently lacks explicit mechanisms for modeling intrinsic dependencies within time series data. Consequently, in the face of nonlinear changes caused by major rule adjustments, sudden shifts in international relations, or long-term strategic sports development initiatives, the model's adaptability and robustness require further enhancement.
Thirdly, in causal effect identification, the combined use of ordinary least squares (OLS) regression and CUSUM control charts to quantify the "famous coach effect" relies heavily on the strong assumption of no unobserved confounding variables. In practical scenarios, confounders such as improvements in training conditions, investments in sports technology, and reforms in youth development systems are often difficult to measure and control comprehensively, potentially impacting the accuracy of effect estimates.
Additionally, due to data availability constraints, this study primarily conducts analyses at the national level, without finer granularity at the individual sports event level. Given that factors such as coaching influence, technological innovation, and equipment advantages are highly sport-specific, macro-level analyses may be insufficient to reveal underlying micro-level mechanisms.
Finally, the model construction and validation are based on historical Summer Olympics data. The applicability of the prediction system and parameter settings to other major sporting events, such as the Winter Olympics or intercontinental multi-sport games, remains to be further validated and adapted.
Future research will focus on several directions: exploring graph structure optimization methods that integrate multi-source relational data; introducing dynamic network representation learning techniques with stronger temporal modeling capabilities; developing multi-layer "nation-project" predictive frameworks to enhance interpretability; and collaborating with sports management agencies to acquire richer, fine-grained annotated data to support more robust causal inference. These improvements are expected to further optimize the model's predictive performance and decision-making utility, broadening its application scope.
This paper proposes a Graph Causal Forest framework for dynamic competitive performance analysis to achieve high-accuracy prediction of Olympic medal counts. Through two-stage feature screening, quantification of coaching effects, and analysis of event configurations, the framework enhances both the accuracy and interpretability of medal forecasts. The innovations include three aspects: first, proposing a hierarchical feature screening-random forest model to address overfitting in high-dimensional data; then introducing the CUSUM control chart to dynamically quantify coaching effects over time for the first time; finally, empirically verifying the causal impact of event rules on medal distribution to provide data support for host country strategies. Tests on the 2025 MCM dataset demonstrate that the proposed framework improves R² by 18% compared to traditional methods. It also effectively identifies emerging nations and optimal policy intervention windows, thereby providing a scientific basis for national sports strategy development and addressing the challenges outlined in this study.
Author Contributions: Conceptualization, M.L., K.H. and B.W.; methodology, B.W.; software, M.L.; validation, M.L. and B.W.; formal analysis, K.H.; investigation, K.H.; resources, K.H.; data curation, K.H.; writing—original draft preparation, M.L.; writing—review and editing, M.L., K.H., B.W. and Q.Z.; visualization, K.H.; supervision, B.W. and Q.Z.; project administration, B.W. and Q.Z.; funding acquisition, Q.Z. All authors have read and agreed to the published version of the manuscript.
Funding: This work was supported in part by the National Natural Science Foundation of China under Grant 62203006, 62173317.
Ethical Approval: Not applicable.
Informed Consent Statement: Not applicable.
Data Availability Statement: Not applicable.
Acknowledgments: Not applicable.
Conflicts of Interest: The authors declare no conflicts of interest.
Chen, T.; Zhang, J. The Transformation of the "Gold Medal Supremacy" Concept in China's Olympic Sports. Sports World 2016, (12), 1.
Cao, S.; Li, T. Study on the Distribution Pattern and Development Trends of Competitive Strength in Asian Winter Sports Games. J. Luohe Vocat. Tech. Coll. 2019, 18(2), 4.
Ge, Q.; Wang, G. A Forecasting Study on Human Resource Demand for Large-Scale Comprehensive Sports Events: A Case Study of the 16th Asian Games in Guangzhou. J. Huizhou Univ. 2010, (6), 4.
The Structural Evolution of China's Olympic Medal-Winning Event Portfolio: A Case Study of Luoping. J. Shanghai Univ. Sport 1996.
Li, J.; Zhang, Y. Prediction for Olympic Medal Tables by Machine Learning. Int. J. Biol. Life Sci. 2025, 10(2), 64–73.
Bernard, A.B.; Busse, M.R. Who Wins the Olympic Games: Economic Resources and Medal Totals. Rev. Econ. Stat. 2004, 86(1), 413–417.
Wang, Y.; Wang, J.; Yang, J.; Xu, Z. STGCN-LSTM for Olympic Medal Prediction: Dynamic Power Modeling and Causal Policy Optimization. arXiv 2025, arXiv:2501.17711.
Hong, G.; Vasudeva, B.; Sharan, V.; Rashtchian, C.; Raghavan, P.; Panigrahy, R. Latent Concept Disentanglement in Transformer-based Language Models. arXiv 2025, arXiv:2506.16975.
Wang, J.T.; Mittal, P.; Song, D.; Jia, R. Data Shapley in One Training Run. arXiv 2024, arXiv:2406.11011.
Rui, H. Association Rule Mining of Discrete Gene Expression Data Based on RGMM. Comput. Appl. Softw. 2014, 31(9), 3.
Zhang, Z. Research on the Evolution of Competition Rules for Competitive Wushu Routine. Ph.D. Thesis, Beijing Sport University, Beijing, China, 2016.
Deng, W.; Ren, Y.; Li, M.; Sutherland, D.J.; Li, X.; Thrampoulidis, C. On the Effect of Negative Gradient in Group Relative Deep Reinforcement Optimization. arXiv 2025, arXiv:2505.18830.
Cheng, M.; Qian, Q.; Ni, Z.; et al. Information Interaction Multitasking Particle Swarm Optimization Algorithm. Pattern Recognit. Artif. Intell. 2019, 32(5), 13.
Gao, H. Research and Application of Machine Learning-Based Image Recognition. Master's Thesis, Central China Normal University, Wuhan, China, 2018.
Shang, H.; Zhang, B.; Ji, H. A Novel Anomaly Detection Method Based on Regression Analysis. J. Henan Univ. Nat. Sci. 2015, 45(6), 5.
Han, S. Change Point Analysis for Two Types of Heavy-Tailed Dependent Sequences. Master's Thesis, Northwestern Polytechnical University, Xi'an, China, 2006.
Ravi, N.; Gabeur, V.; Hu, Y.-T.; Hu, R.; Ryali, C.; Ma, T.; Khedr, H.; Rädle, R.; Rolland, C.; Gustafson, L.; Mintun, E.; Pan, J.; Alwala, K.; Carion, N.; Wu, C.; Girshick, R.; Dollár, P.; Feichtenhofer, C. SAM 2: Segment Anything in Images and Videos. arXiv 2024, arXiv:2408.00714.
Zheng, Y.; Zhao, S.; Zhong, W.; Lv, P. An Olympic Medal Prediction Model Based on Random Forest Regression. J. Stat. Appl. 2025, 14(4), 47–54.
Xiao, J. Study on Unbalanced Data Classification Method Based on Random Forest. Master's Thesis, Harbin Institute of Technology, Harbin, China, 2024.
Liu, Y.; Ren, Z. Hybrid Model Modeling Method and Application Based on Neural Network. Comput. Simul. 2007, 24(2), 4.
Cong, D.; Zhao, S.; Li, X.; et al. Study on the Applicability of Random Forest Algorithm Based on Optimal Feature Space in WorldView-2 Image Classification. Sci. Technol. Eng. 2016, 16(31), 7.