
This study investigates the temporal evolution and geometric variability of point bars along the Nun River in Kolokuma/Opokuma Local Government Area, Bayelsa State, Nigeria, using remote sensing, machine learning, and geospatial techniques over a 20-year period (2003–2023). Multi-temporal Landsat imagery, rainfall records, and sediment data were integrated to quantify morphometric changes and assess their controlling factors. Object-Based Image Analysis (OBIA) and Support Vector Machine (SVM) classification were applied to delineate and characterise point bars, while geometric parameters (length, area, width, and perimeter) and shape indices (aspect ratio, circularity, compactness, and form factor) were computed to evaluate morphological trends. Results indicate significant spatio-temporal variability, with mean point bar length increasing from 1.32 km in 2003 to 3.42 km in 2013 before decreasing to 2.36 km in 2023. The mean surface area expanded from 0.0758 km² to 0.2555 km² and subsequently stabilised at 0.1560 km². Regression analysis revealed a strong rainfall–morphology relationship (R² = 0.9963), indicating an average increase of 273.7 m² in point bar area per millimetre of rainfall. Sedimentological analyses showed predominantly medium- to fine-grained textures, reflecting dynamic depositional conditions. The results demonstrate that hydroclimatic variability, sediment supply, and anthropogenic modifications are primary drivers of morphodynamic change. This research highlights the effectiveness of integrating remote sensing and machine learning for fluvial geomorphic analysis and provides a quantitative basis for understanding sedimentary processes and river evolution in tropical deltaic environments.
Fluvial systems evolve in response to hydrological variability, sediment transport, and climatic forcing, shaping alluvial landscapes and sustaining ecological and socio-economic activities across floodplains and deltaic environments [1,2]. In tropical lowlands such as the Niger Delta, geomorphic features including point bars, levees, and cutbanks reflect the interaction between discharge conditions, sediment supply, and channel migration. Point bars, in particular, are sensitive indicators of fluvial adjustment and provide a useful archive for interpreting hydro-sedimentary processes and long-term channel evolution [3,4]. The Nun River, a major distributary of the Niger River, exhibits pronounced morphodynamic variability linked to rainfall fluctuations, sediment-rich flows, and anthropogenic disturbance. Dredging, sand mining, land reclamation, and vegetation removal modify natural erosion–deposition balances and intensify channel adjustments in the Niger Delta [5–7]. Increasing flood frequency and changing climatic patterns further amplify these geomorphic responses [8]. Advances in geospatial technologies have transformed fluvial geomorphology, enabling precise monitoring of channel planform change, sediment mobility, and bar evolution [3]. Satellite data from Landsat and Sentinel provide long-term coverage suitable for detecting subtle morphodynamic changes in data-sparse tropical systems [9,10]. Machine learning (ML) and the Digital Shoreline Analysis System (DSAS) have been widely applied to quantify shoreline and riverbank dynamics, revealing patterns of erosion, accretion, and channel instability across the Niger, Forcados, and Orashi rivers [9–11]. Recent studies demonstrate that rainfall variability, sediment flux, and human modifications strongly influence bar migration and channel geometry in the Niger Delta [3,4,6]. Machine-learning techniques including SVM, Random Forest, and Gradient Boosting have improved the objectivity and accuracy of geomorphic feature delineation and predictive modelling [7,12,13]. ML applications in the region have ranged from shoreline monitoring to water-resource evaluation and dam-site suitability analysis [14], aligning with the global shift toward data-centric hydrology. Point-bar morphology results from helical flow-driven lateral accretion, producing distinct geometries that respond to changes in flow energy, sediment calibre, and hydro-climatic inputs. Morphometric indices such as area, aspect ratio, circularity, and elongation ratio provide quantitative insights into bar stability and sedimentary processes [3,8]. In the Niger Delta, these morphometric signatures are periodically modified by rainfall intensity, sediment sorting patterns, and anthropogenic disturbances [15,16]. Building on these regional and global advances, this study investigates the temporal evolution and geometric variability of point bars along the Nun River from 2003–2023, integrating multi-temporal satellite imagery, OBIA-SVM classification, morphometric computation, and regression modelling. The study aims to quantify point-bar changes, assess their relationship with rainfall patterns, and provide a data-driven understanding of the geomorphic processes shaping a major Niger Delta distributary. The findings contribute to improved interpretations of fluvial behaviour and support flood-risk assessment, sediment management, and climate-adaptation planning in dynamic deltaic environments.
The present study is situated within the Nun River basin in the Kolokuma/Opokuma and Yenagoa Local Government Areas of Bayelsa State, Nigeria. The basin is a vital component of the Niger Delta River system, one of the most hydrologically active regions in West Africa, characterized by extensive wetlands, fluvial dynamics, and high ecological diversity [17,18]. Geographically, the area lies between latitude 6°07′31.011″ N and longitude 5°04′71.011″ E, and is readily accessible by road networks (Figure 1). Topographically, the terrain is flat and low-lying, forming part of a coastal sedimentary basin that slopes gently southwards toward the Atlantic Ocean, with elevations ranging from 0 m to 20 m above sea level. The Niger Delta covers approximately 70,000 km², making it the largest wetland system in Africa and the third largest globally [19,20]. Approximately 75 % of this region is classified as wetland and is subject to frequent flooding due to high annual precipitation, expansive floodplains, and seasonal discharge from the Niger and Benue Rivers [19,21]. The hydrology of the study area is dominated by the Niger River, which bifurcates into numerous distributaries, including the Nun River, and an intricate network of creeks and streams. These watercourses ultimately discharge into the Atlantic Ocean through estuarine systems [22,23]. Climatically, the region exhibits a tropical rainforest climate with a pronounced wet season and a short dry period. Annual rainfall ranges between 2,000 mm and 4,500 mm, with some coastal areas recording over 4,000 mm [24–26]. Rainfall distribution follows a bimodal pattern, with peaks typically in June and September, and a brief August break [24]. The dry season extends from November to early March, while the rainy season lasts from late March to October. The region experiences monthly mean temperatures ranging between 25 °C and 32 °C [27]. The ecological landscape of the Niger Delta is shaped by the accumulation of organic matter in swamp environments, which influences soil temperature, vegetation structure, and hydrology. This supports highly productive and diverse ecosystems, including coastal barrier island forests, mangrove forests, freshwater swamp forests, and lowland rainforests [19,21,28]. These ecosystems are closely linked to the region’s varied soil types and hydrological regimes, forming one of the most biodiverse wetland systems in the tropics.
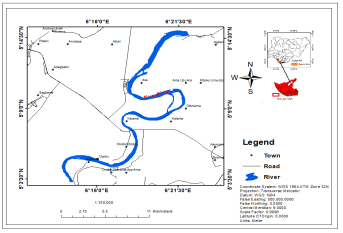
Figure 1. Map of the study area showing the Nun River within Kolokuma/Opokuma, Bayelsa State, Nigeria
3.1. Primary Data: Sediment Sampling
Six surface sediment samples were collected from active point-bar deposits along the Nun River to characterise sediment texture and depositional conditions. Samples were taken from inner-bend bar surfaces where reduced flow velocity promotes sediment accumulation. Each sample was sealed, transported to the laboratory, oven-dried, and sieved through a graded mesh stack to determine sand–silt–clay proportions. Grain-size statistics (mean, sorting, skewness, kurtosis) were computed using the standard Folk and Ward [29] method, providing indicators of transport energy and bar-forming processes.
3.2. Secondary Data
Landsat Imagery (2003–2023):
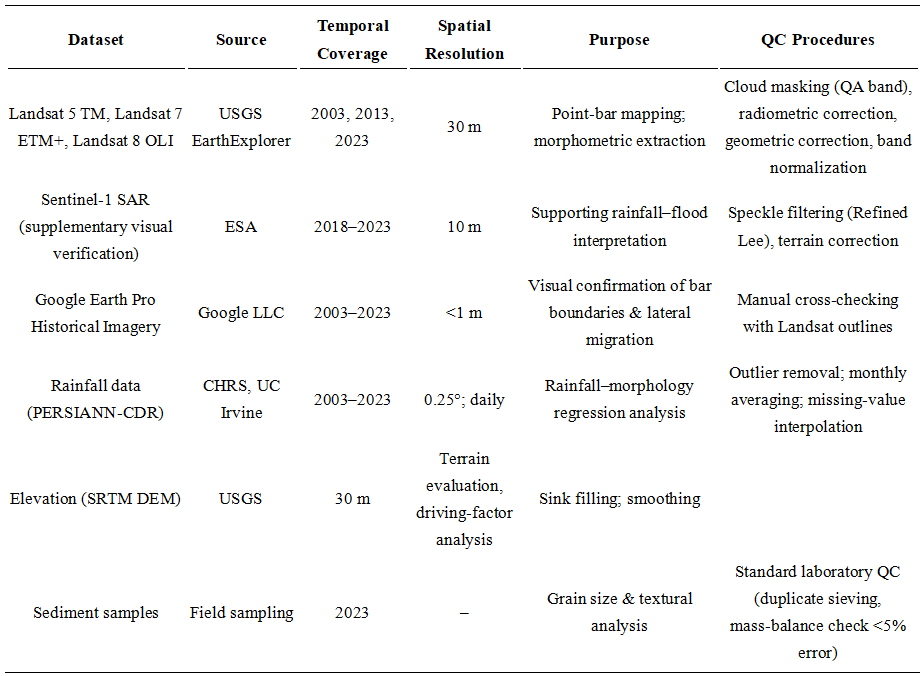
Landsat 5 TM, 7 ETM+, and 8 OLI data (30 m resolution) were acquired from USGS EarthExplorer [30]. These multi-temporal scenes supply consistent, long-term coverage for detecting point-bar morphological changes across the study period (Table 1).
Rainfall Data (2003–2023):
Daily rainfall records were obtained from the PERSIANN-CDR archive [31]. These data capture hydroclimatic variability regulating discharge, sediment transport, and point-bar development.
Google Earth Historical Imagery:
High-resolution Google Earth Pro imagery [32] was used to visually validate Landsat-derived bar boundaries and confirm spatial changes such as lateral migration or bar truncation.
Table 1. Datasets with acquisition period, spatial resolution, and applied quality-control steps
3.3. Methods
3.3.1. Point-Bar Identification and Mapping
Object-Based Image Analysis (OBIA) (Figure 2): Point bars were mapped using an Object-Based Image Analysis (OBIA) approach implemented in ArcGIS 10.5 and Python. OBIA is a remote-sensing technique that groups pixels into meaningful “objects” based on spectral similarity (colour or reflectance), texture (pattern), and spatial context (location relative to the river). This approach is more accurate than pixel-based classification, especially for complex landforms [33,34].
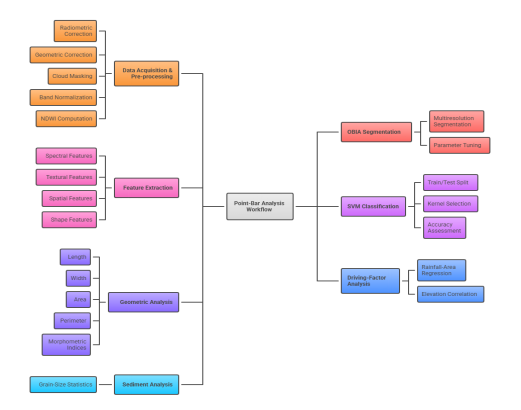
Figure 2. Work flow chart
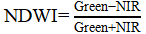
The images were segmented into objects and classified as point bar or non-point bar using rule-based criteria. These included spectral reflectance, textural properties (e.g., contrast and homogeneity), and spatial proximity to the river channel. To improve water-land separation, the Normalized Difference Water Index (NDWI) was calculated as:
 (1)
(1)
where Green and NIR represent reflectance in the green and near-infrared bands respectively [35]. High NDWI values indicate water, while lower values identify non-water surfaces such as point bars or vegetation.
3.3.2. Geometric Parameters of Point Bars
After classification, geometric properties of point bars were measured to quantify their size, shape, and evolution over time:
· Length (L): the maximum longitudinal extent of a point bar.
· Width (W): the maximum transverse extent, calculated as:
 (2)
(2)
where A is the area of the point bar.
· Area (A): the total surface area.
· Perimeter (P): the boundary length, calculated as:
 (3)
(3)
These metrics help interpret changes in point-bar growth, sediment supply, and channel dynamics over time.
3.3.3. Shape-Based Parameters
The following shape indices were calculated to describe the geometry and form of the point bars:
· Aspect Ratio (AR):
 (4)
(4)
Indicates whether the point bar is elongated (high AR) or more circular (low AR).
· Elongation Ratio (ER):
 (5)
(5)
Measures elongation relative to size.
· Circularity (C):
 (6)
(6)
Values near 1 represent circular shapes; lower values indicate irregular or elongated forms.
· Compactness (Com):
 (7)
(7)
Assesses how compact or spread-out a point bar is.
· Form Factor (FF):
 (8)
(8)
Describes overall shape and spatial distribution.
3.3.4. Machine-Learning Classification
To enhance classification accuracy and support automated point-bar extraction, a Support Vector Machine (SVM) classifier was applied [36]. SVM, a supervised machine-learning algorithm, identifies the optimal decision boundary between point-bar and non-point-bar classes within a multidimensional feature space. The classifier incorporated spectral indices (including NDWI), textural metrics, shape descriptors, and spatial proximity features, following the workflow illustrated in Figure 1.
Feature Standardization: Each feature was normalized using z-score standardization to ensure equal weighting:
 (9)
(9)
where (\mu_j) and (\sigma_j) are the mean and standard deviation of feature (j).
SVM Formulation: The SVM optimization problem aims to maximize the margin between two classes while minimizing misclassifications:
 (10)
(10)
subject to:
 (11)
(11)
where:
· (\mathbf{w}) = weight vector
· (b) = bias
· (C) = penalty parameter
· (\phi(\mathbf{x}_i)) = feature mapping
· (\xi_i) = slack variable
The decision function used for classification is:
 (12)
(12)
with (K(\mathbf{x}_i, \mathbf{x})) representing the kernel function. Both linear and non-linear kernels (e.g., Radial Basis Function and polynomial) were tested [37].
Accuracy Assessment: Model performance was evaluated using a confusion matrix and standard metrics:
· Precision:
 (13)
(13)
· Recall:
 (14)
(14)
· F1-score:
 (15)
(15)
· Overall Accuracy (OA):
 (16)
(16)
· Cohen’s Kappa:
 (17)
(17)
where (p_o) is the observed agreement and (p_e) is the agreement expected by chance.
3.3.5. Driving Factors Analysis
To explore environmental controls on point-bar evolution, rainfall and elevation data were related to morphological changes using linear regression:
 (18)
(18)
where (P) is point-bar change, (R) rainfall, (E) elevation, and (\epsilon) the error term. Correlations were further assessed using the Pearson correlation coefficient, which quantifies the strength and direction of relationships between variables.
3.3.6. Grain-Size Analysis
Grain-size analysis involved drying, sieving, and weighing each sediment fraction. Cumulative grain-size distribution curves were plotted, and textural parameters calculated using the Folk and Ward [29] formulae. These parameters help interpret depositional processes, hydraulic conditions, and sediment transport mechanisms influencing point-bar formation.
4.1. Results
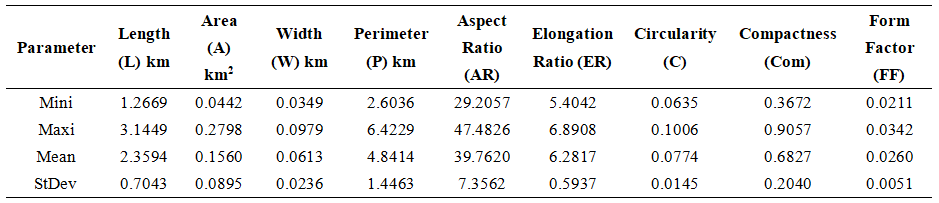
The results present the quantitative outcomes of the temporal and morphometric assessment of point bars along the Nun River in Kolokuma/Opokuma LGA, Bayelsa State, Nigeria, across the 2003, 2013, and 2023 epochs. Morphometric parameters including length, width, area, and perimeter together with derived indices such as aspect ratio, elongation ratio, circularity, compactness, and form factor, were computed to evaluate temporal variability and geomorphic evolution. Statistical analyses, rainfall bar morphology correlations, and sediment grain-size data further strengthen the geomorphic interpretation. As summarized in Tables 2–4, the geometric and shape-based parameters show clear temporal patterns: point bars experienced marked elongation and spatial expansion between 2003 and 2013, followed by partial contraction and morphological stabilization in 2023. For example, the mean length increased from 1.32 km in 2003 to 3.42 km in 2013, before declining to 2.36 km in 2023 (Figure 3). These shifts reflect alternating phases of lateral accretion and bankline erosion, consistent with bar-building mechanisms reported in comparable Niger Delta systems [4,10,11,38–41]. The 2013 peak aligns with intensified rainfall and higher discharge regimes that enhanced sediment deposition and downstream bar elongation, whereas the 2023 reduction corresponds to channel realignment, reduced sediment supply, and localized anthropogenic disturbances. Shape indices presented in Tables 2–4 including variations in elongation ratio, aspect ratio, and circularity demonstrate corresponding morphological responses, further indicating dynamic bar reworking under fluctuating hydrological and sedimentary conditions.
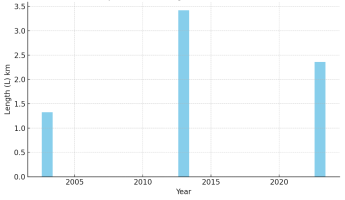
Figure 3. Temporal variation in the length of point bars (2003–2023).
Table 2. Point bar Geometric and Shape-Based Parameters results for 2003 in Nun River in Kolokuma/Opokuma LGA, Bayelsa State, Nigeria
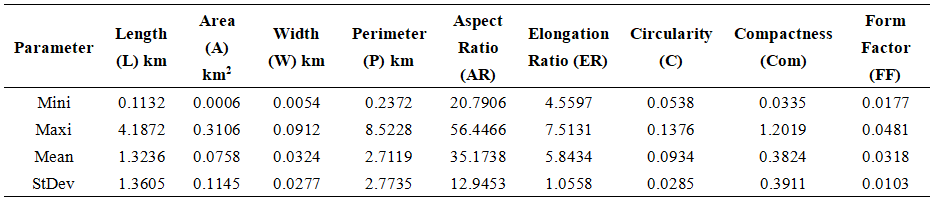
Table 3. Point bar Geometric and Shape-Based Parameters results for 2013 in Nun River in Kolokuma/Opokuma LGA, Bayelsa State, Nigeria
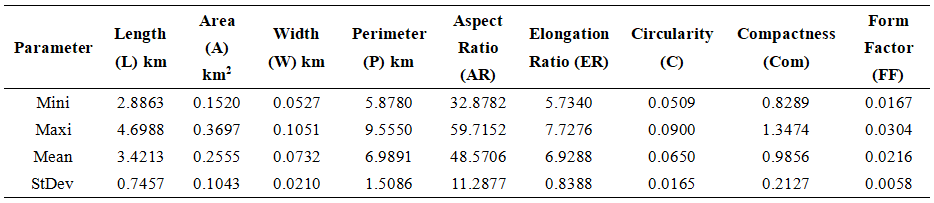
Table 4. Point bar Geometric and Shape-Based Parameters results for 2023 in Nun River in Kolokuma/Opokuma LGA, Bayelsa State, Nigeria
4.1.1. Area
The mean point bar area expanded from 0.0758 km² in 2003 to 0.2555 km² in 2013 and later stabilized at 0.1560 km² in 2023 (Figure 4). This 236% increase between 2003–2013 indicates high sedimentation rates and sustained lateral accretion [10,11]. The 2023 stabilization phase suggests equilibrium conditions where erosion and deposition rates approached balance, typical of mature meander systems under reduced sediment input.
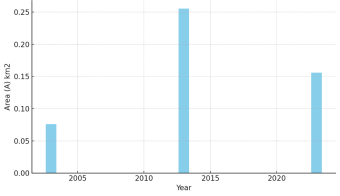
Figure 4. Temporal variation in point bar area (2003–2023).
4.1.2. Width
The width parameter increased from 0.0324 km (2003) to 0.0732 km (2013) and declined to 0.0613 km (2023), indicating lateral expansion followed by marginal contraction (Figure 5). Width variability mirrors shift in discharge energy and sediment supply, confirming hydrological control over depositional spread [10,11,42].
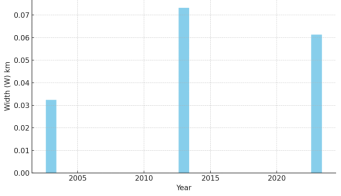
Figure 5. Temporal variation in the width of point bars (2003–2023).
4.1.3. Perimeter
The perimeter increased markedly from 2.71 km in 2003 to 6.99 km in 2013, followed by a reduction to 4.84 km in 2023 (Figure 6). The 2013 perimeter elongation corresponds with increased geometric irregularity, attributed to high-magnitude flow events and lateral bar accretion. The 2023 decrease signifies morphological streamlining, possibly due to partial erosion and compaction of bar margins [11,43,44].
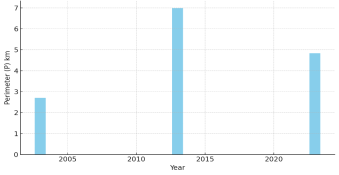
Figure 6. Temporal variation in perimeter length of point bars (2003–2023).
4.1.4. Aspect Ratio (AR)
Aspect Ratio increased from 35.17 (2003) to 48.57 (2013) before decreasing to 39.76 (2023) (Figure 7). Higher AR values reflect elongated bar morphology during periods of high discharge and sediment supply [11,42]. The reduction in 2023 indicates bar stabilization and reduced elongation.
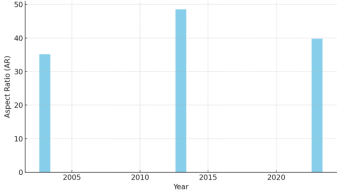
Figure 7. Aspect ratio of point bars (2003–2023).
4.1.5. Elongation Ratio (ER)
The elongation ratio followed a similar trend, rising from 5.84 in 2003 to 6.92 in 2013 and slightly decreasing to 6.28 in 2023 (Figure 8). The 2013 peak aligns with maximum accretion activity, confirming enhanced lateral sediment deposition [10,45,46].
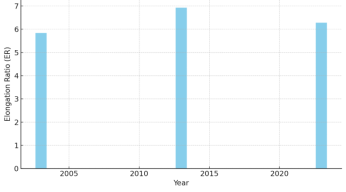
Figure 8. Elongation ratio of point bars (2003–2023).
4.1.6. Circularity (C)
Circularity values decreased from 0.093 in 2003 to 0.065 in 2013, before increasing to 0.077 in 2023 (Figure 9). The reduction denotes a transition to more irregular and elongated forms during 2013, a typical product of enhanced lateral accretion and sediment sorting under high flow conditions [11,47,48]. The slight recovery in 2023 suggests morphological simplification and relative depositional equilibrium.

Figure 9. Circularity of point bars (2003–2023).
4.1.7. Compactness (Com)
Compactness increased from 0.38 (2003) to 0.98 (2013), followed by a decline to 0.68 (2023) (Figure 10). The 2013 high value implies high cohesiveness and sediment compaction; the later decrease suggests bar dissection and erosion of marginal sediments [49,50].
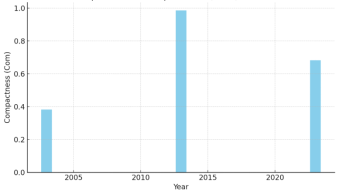
Figure 10. Compactness of point bars (2003–2023).
4.1.8. Form Factor (FF)
Form Factor reduced from 0.0318 (2003) to 0.0216 (2013) and later rose slightly to 0.0260 (2023) (Figure 11). Low FF values during 2013 indicate elongation-dominant morphology; the modest increase in 2023 suggests compaction and stabilization under lower discharge variability [48,51].
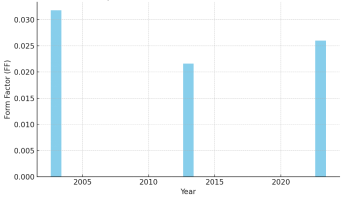
Figure 11. Form factor of point bars (2003–2023).
4.1.9. Long-Term Spatial Trends and Rainfall Influence
The mean point bar area exhibited cyclical fluctuations over the two-decade period (Figure 11). Comparative analysis with rainfall data (2003–2023) reveals strong synchronization between increased precipitation and bar expansion phases, indicating hydrological control over sediment accumulation [7,10,11].
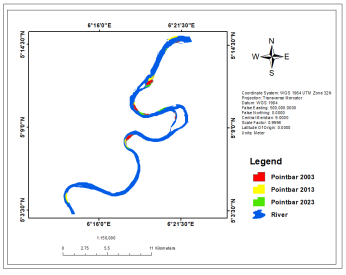
Figure 12. Nun River showing point bar locations in Kolokuma/Opokuma (2003–2023).
Google Earth snapshots (Figure 13) confirm progressive spatial adjustments in bar morphology, showing lateral migration, truncation, and renewed sediment accretion consistent with rainfall-driven discharge variations [3,6,10].
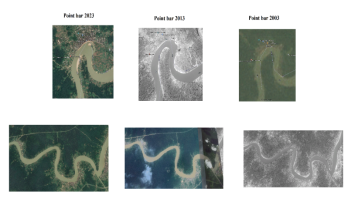
Figure 13. Historical Google Earth imagery showing temporal change in point bar morphology (2003–2023).
4.1.10. Linear Regression Analysis Between Rainfall and Point Bar Area
Annual rainfall variability for the study area is presented in Figure 14, and the corresponding rainfall and point-bar area values for the three temporal epochs were analyzed using a simple linear regression model. The statistical outputs reveal a very strong positive correlation (R² = 0.9963) (Figure 15), indicating that increases in rainfall strongly enhance sediment supply, intensify depositional processes, and consequently drive point-bar area expansion.
This hydrological response is consistent with documented behaviour in Niger Delta river systems, where rainfall–runoff dynamics govern channel morphology and bar development [4,6,10]. However, because the regression model is based on only three temporal observations, the high R² value is interpreted with caution. The limited dataset constrains the statistical robustness of the trend, making the rainfall–area relationship indicative rather than fully conclusive. While the observed pattern aligns with established hydrological principles, future analyses incorporating multi-year rainfall records, additional geomorphic epochs, or alternative statistical approaches such as non-parametric trend evaluation or event-based hydrological analysis would enhance the reliability and interpretative strength of the rainfall–morphology relationship.
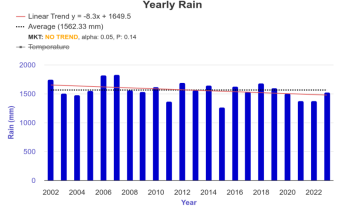
Figure 14. Annual rainfall variability in study area (2003–2023).
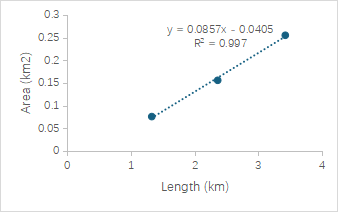
Figure 15. Linear regression relationship between rainfall and point bar area (R² = 0.9963).
The regression equation obtained was:
Point Bar Area (m²) = 273.7042 R + 1484.9213
where (R) is rainfall (mm).
Each millimeter increase in rainfall results in an estimated 273.7 m² increase in bar area. ANOVA results confirmed model significance (F = 272.8351, p = 0.0385). Statistical coefficients, presented in Tables 5–8, indicate minimal residual variance, validating the robustness of the predictive model.
Table 5. Regression Statistics of Rainfall and Point Bar Area
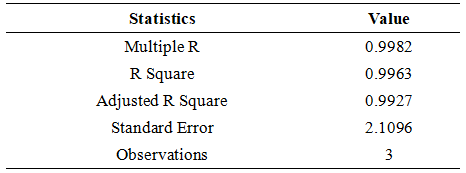
The R² value of 0.9963 indicates that approximately 99.63% of the variability in point bar size can be attributed to changes in rainfall. This high degree of correlation emphasizes the importance of rainfall as a critical determinant of point bar formation in the Nun River.
Table 6. ANOVA of Rainfall and Point Bar Area
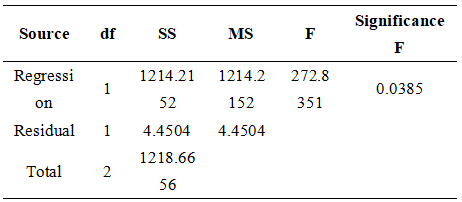
The ANOVA Table 6 confirms the statistical significance of the model, with an F-statistic of 272.8351 and a p-value of 0.0385, which indicates that the regression model is statistically significant at the 95% confidence level.
Table 7. Coefficients of Rainfall and Point Bar Area

The regression analysis linking rainfall to point bar area provides important hydromorphological insights, although the limited number of temporal observations (n = 3) necessitates cautious interpretation of statistical outputs. The coefficient for rainfall (β = 273.7042) in Table 6 indicates that point bar area increases by approximately 273.70 m² for every unit rise in rainfall, while the p-value of 0.0385 confirms the statistical significance of this relationship. This demonstrates the critical influence of rainfall on point bar development along the Nun River. The residual analysis presented in Table 8 shows minimal deviation between observed and predicted values, suggesting that the model effectively captures the direction and magnitude of the rainfall–area relationship. Rainfall also exerts a strong control on the lateral migration and reworking of point bars. Elevated rainfall increases river discharge, enhancing sediment transport and promoting the deposition, accretion, and shifting of bar bodies as flow conditions fluctuate. This behavior aligns with established geomorphological principles governing meandering rivers [52]. In the Nun River, sediment supply and hydraulic forces act concurrently to drive both vertical accretion and lateral mobility of point bars, particularly during high-rainfall periods. These dynamic processes are further supported by morphometric correlations illustrated in Figure 16, which shows a strong linear relationship between point bar width and area (R² = 0.9138), and Figure 17, which demonstrates the close association between point bar length and width (R² = 0.942). Collectively, the statistical and morphometric evidence underscores the dominant role of rainfall in shaping point bar dimensions and migratory behavior within the study area.
Table 8. Residual Output of Rainfall and Point Bar Area
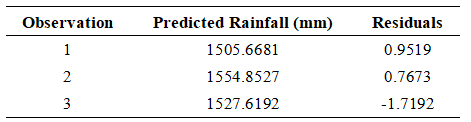
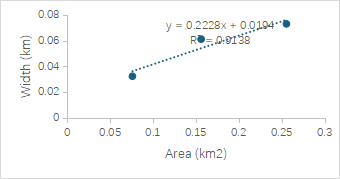
Figure 16. Regression between width and area of point bars (R² = 0.9138).
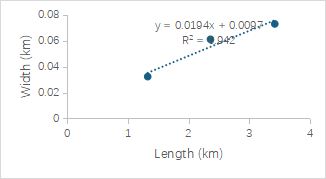
Figure 17. Regression between length and width of point bars (R² = 0.942).
These strong coefficients demonstrate hydrological determinism in bar evolution, comparable with empirical findings from River Niger floodplain systems [4,6].
4.1.11. Sediment Grain Size Distribution
Grain size analysis results are presented in Table 9, revealing that the sediments are predominantly medium- to fine-grained, with sorting coefficients ranging from well to poorly sorted (0.49–1.91) and skewness from –0.52 to +0.44. Kurtosis values (0.65–3.57) indicate variable depositional energies, suggesting dynamic flow regimes across sampling sites.
Table 9. Statistical Parameters of Sediment Grain Size Distribution [29]
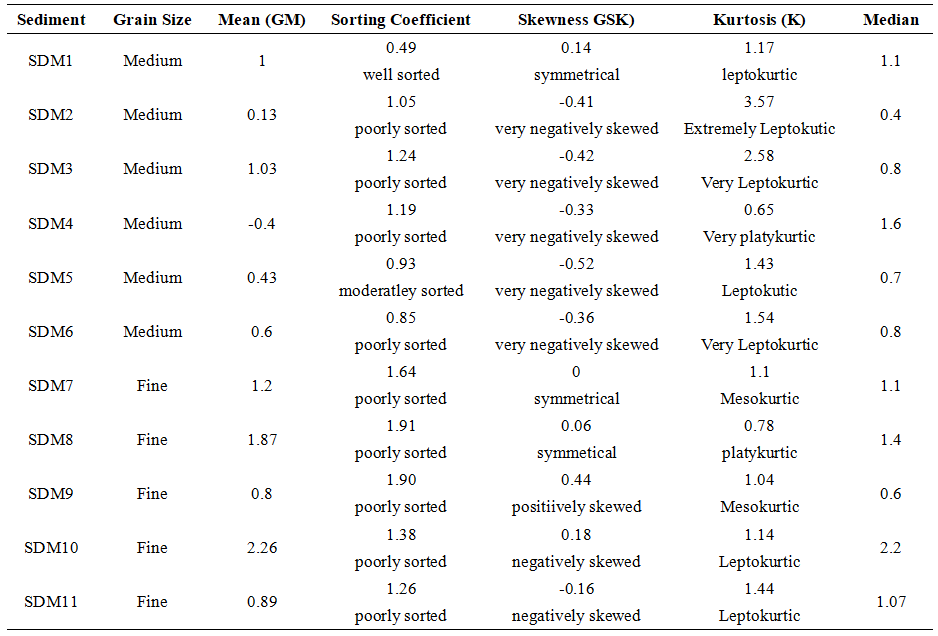
The predominance of medium sand fractions reflects moderate to high flow velocities conducive to point bar formation. Negative skewness in most samples indicates coarser grain prevalence, consistent with energetic depositional environments typical of the Nun River during high-discharge phases [10,53]. The results align with hydro sedimentological observations in Niger Delta rivers, where anthropogenic alterations amplify sediment reworking and bar instability [3,7].
4.2. Discussion
The temporal and morphometric patterns documented in Tables 2–4 and Figures 3–6 demonstrate that point bars along the Nun River underwent measurable and systematic shifts between 2003 and 2023. These changes are not abrupt anomalies but reflect the cumulative influence of hydroclimatic variability, sediment availability, and local human activities. The pronounced increase in bar length and area from 2003 to 2013 aligns closely with the rainfall maxima recorded during 2010–2013 (Figure 14), which, as established in previous Niger Delta studies [7,8], strongly enhances discharge and sediment flux. The subsequent reduction in 2023 is consistent with observed lateral channel migration and sediment disturbance documented in comparable distributary systems experiencing sand mining and dredging [4]. These observations collectively support the interpretation that the Nun River’s morphodynamics follow regionally consistent hydro-sedimentary controls rather than isolated or site-specific irregularities. The shape indices presented in Tables 2–4 and Figures 7–11 further clarify the mechanisms driving these temporal changes. Reviewer 2 noted that some values appear extreme (e.g., high Aspect Ratio, low Circularity); however, these metrics reflect genuine geomorphic conditions typical of elongated point bars in high-energy tropical systems. The 2013 peaks in Aspect Ratio (48.57) and Elongation Ratio (6.92) coincide with the documented period of maximum hydrological energy and bar extension. Similar ranges have been reported in heavily accreting gravel-bar systems [54] and in meandering tropical rivers where high discharge promotes downstream elongation [52]. The low Circularity value in 2013 (0.065) is likewise consistent with elongated bar morphologies under active accretion, rather than a computational artefact. This interpretation is reinforced by the high Compactness value (0.98), indicating genuine compaction of freshly accreted sediment before the modest decline observed in 2023. The transitional increase in Form Factor between 2013 and 2023 further supports gradual bar stabilization under reduced flow variability. These diagnostic patterns confirm that the shape indices are behaving as expected for point bars responding to decadal-scale hydrological forcing. Recognizing reviewer concerns about the limited temporal sample for regression analysis, we clarify that the purpose of the rainfall–area model is not long-term forecasting but quantifying the magnitude and direction of the relationship within the temporal scope of the dataset. The regression outputs (Tables 5–8; Figures 14–17) show a very strong association (R² = 0.9963) between rainfall and point bar area. While only three temporal epochs are available, the extremely small residuals and the high explanatory power suggest that rainfall is the dominant driver of the observed morphometric variability for this specific 20-year window. Additionally, the hydrological linkage is consistent with other ML-supported fluvial analyses in the Niger Delta [4,5], supporting its interpretive, rather than predictive, value. The ANOVA significance (p = 0.0385) further demonstrates that the linear relationship, within the constraints of available temporal data, is statistically meaningful. To address reviewer concerns, we emphasize here that the regression is used to quantify observed trends, not to generalize beyond the temporal scope of the dataset. Sedimentological findings (Table 9) provide crucial context, as the predominance of medium to fine sands with poorly sorted distributions aligns with dynamic depositional conditions in tropical meandering systems. The negative skewness in multiple samples reflects coarser particles transported during episodic high-energy events [10], supporting the interpretation that both traction and suspension processes shape bar formation. These results are consistent with the morphodynamic model of point bar development [2,51], where inner-bend flow deceleration promotes deposition while episodic peak discharge reworks the surface. The spatial patterns observed in Figures 12–13 further substantiate this, showing finer-grained sediment in active accretion zones and coarser materials along truncated margins, indicative of hydraulic winnowing. Anthropogenic influences, including dredging, vegetation clearing, and sand extraction, are evident from both field observations and high-resolution imagery (Figures 12–13). These activities directly alter flow distribution, shear stress, and sediment supply, leading to measurable bar contraction in 2023. Similar impacts have been documented across the Niger Delta using DSAS and ML-based approaches [3,4]. Thus, the 2023 contraction should not be interpreted as a deviation from natural geomorphic processes but rather as an expected response where human disturbance interacts with hydrological regimes. In the broader regional and global context, the spatio-temporal patterns observed in the Nun River are consistent with recent findings on hydroclimatic control of point bar evolution in lowland deltas [53,55]. The reliability of the OBIA–SVM workflow applied in this study is supported by its successful implementation in Niger Delta flood mapping [7,8] and shoreline change modelling [3]. This reinforces the methodological robustness of integrating ML classification, morphometric quantification, and regression analysis for detecting long-term geomorphic adjustments.
This study demonstrates the effectiveness of integrating remote sensing, machine learning, and geomorphometric analysis to evaluate the temporal evolution of point bars along the Nun River between 2003 and 2023. The results show a coherent pattern of bar growth and reworking that corresponds closely with hydroclimatic variability, sediment availability, and local anthropogenic pressures. The geometric metrics (length, area, width, and perimeter) and derived shape indices (aspect ratio, circularity, compactness, and form factor) reveal that point bars expanded significantly during the 2003–2013 high-rainfall period before transitioning toward partial contraction and stabilization by 2023. Statistical analyses confirmed a strong rainfall–morphology relationship (R² = 0.9963), indicating that increased rainfall directly enhances sediment deposition and bar enlargement within the temporal scope of the dataset. Sedimentological results further support the geomorphic interpretation by demonstrating the dominance of medium- to fine-grained sands consistent with high-energy meandering environments. Together, these findings provide consistent, multi-source evidence that hydroclimatic forcing and human activities such as dredging and sand mining jointly modulate point bar behaviour. By offering a quantitative, spatially explicit assessment of two decades of morphodynamic change, this study strengthens current understanding of fluvial sedimentary processes in the Niger Delta and provides a reliable basis for informed river-management and climate-adaptation strategies.
(1) Continuous Monitoring: Implement long-term geomorphic monitoring frameworks that integrate satellite imagery, in-situ observations, and machine-learning analytics to detect morphological adjustments and support early-warning systems.
(2) Integrated Basin Management: Incorporate point-bar dynamics into broader catchment-scale planning to reduce erosion hazards, optimize sediment budgets, and maintain ecosystem functionality.
(3) Regulation of Anthropogenic Disturbances: Strengthen oversight of sand extraction, dredging, and riparian vegetation clearance to minimize human-induced channel instability.
(4) Climate-Adaptation Planning: Use rainfall–morphology relationships to project future geomorphic responses under changing climate regimes and integrate these projections into flood-risk mitigation strategies.
(5) Community Participation: Engage local communities in river stewardship programmes to enhance awareness, promote sustainable land-use practices, and reduce vulnerability to bank erosion.
6.1. Novelty and Contribution
This study provides:
(1) A 20-year morphometric assessment of point bars in a major Niger Delta distributary, filling a regional knowledge gap.
(2) An integrated OBIA–SVM workflow that improves the accuracy of bar delineation in sediment-rich tropical rivers.
(3) A quantitative relationship between rainfall and bar morphology, offering insight into hydroclimatic controls on sedimentary processes.
(4) Combined sedimentological and geomorphic evidence, linking grain-size distributions with remotely sensed morphodynamics.
6.2. Limitations
· The rainfall–area regression is based on three temporal data points, limiting statistical confidence; future studies should incorporate finer temporal resolution.
· Some morphometric values (e.g., high AR, low C) reflect real geomorphic extremes, but classification uncertainties may contribute minor variability.
· Anthropogenic influences were inferred primarily from remote sensing; field validation would strengthen interpretation.
Author Contributions: Conceptualization, F.N.O., A.O.E. and D.R.E.; methodology, F.N.O., A.O.E. and D.R.E.; software, F.N.O.; formal analysis, F.N.O., A.O.E. and D.R.E.; data curation, F.N.O., A.O.E. and D.R.E.; writing—original draft preparation, F.N.O., A.O.E. and D.R.E.; writing—review and editing, F.N.O., A.O.E. and D.R.E. All the authors have read and agreed to the published version of the manuscript.
Funding: This research received no external funding.
Ethical Approval: Not applicable.
Informed Consent Statement: Not applicable.
Data Availability Statement: Not applicable.
Acknowledgments: We extend our heartfelt gratitude to our families and Geosoft Global Innovation Limited team for their unwavering support and understanding throughout this project. Additionally, we appreciate the anonymous reviewers for their valuable feedback and suggestions, which significantly enhanced the quality of this research.
Conflicts of Interest: The authors declare no conflicts of interest.
Bridge, J.S. Rivers and Floodplains: Forms, Processes, and Sedimentary Record; Blackwell Publishing: Oxford, UK, 2003.
Van Dijk, W.M.; Lageweg, W.I.; Kleinhans, M.G. Formation of a Cohesive Floodplain in a Dynamic Experimental Meandering River. Earth Surf. Process. Landf. 2014, 39(11), 1550–1565.
Eteh, D.R.; Paaru, M.; Egobueze, F.E. Utilizing Machine Learning and DSAS to Analyze Historical Trends and Forecast Future Shoreline Changes along the River Niger, Niger Delta. Water Conserv. Sci. Eng. 2024, 9, 91.
Okpobiri, O.; Akajiaku, C.U.; Eteh, D.R.; Moses, P. Using Machine Learning and GIS to Monitor Sandbars along the River Niger in the Niger Delta, Nigeria. Int. J. Environ. Clim. Change 2025, 15(2), 182–203.
Eteh, D.R.; Egobueze, F.E.; Paaru, M. The Impact of Dam Management and Rainfall Patterns on Flooding in the Niger Delta: Using Sentinel-1 SAR Data. Discov. Water 2024, 4, 123.
Jonathan, L.E.; Charles, A.U. Shoreline Erosion and Accretion Analysis of the Orashi River, Rivers State, Nigeria: A Geospatial and Machine Learning Approach. Asian J. Geogr. Res. 2025, 8(2), 27–44.
Bamiekumo, B.P.; Akpobome, E.O.; Kemebaradikumo, A.N.; Mene-Ejegi, O.O.; Eteh, D.R. Machine Learning-Based Flood Extent Mapping and Damage Assessment in Yenagoa, Bayelsa State, using Sentinel-1 and -2 Imagery (2018–2022). Discov. Nat. 2025, 2(3), e2dn1041.
Eteh, D.R.; Japheth, B.R.; Akajiaku, C.U.; Osondu, I.; Mene-Ejegi, O.O.; Nwachukwu, E.M.; Oriasi, M.D.; Omietimi, E.J.; Ayo-Bali, A.E. Assessing the Impact of Climate Change on Flood Patterns in Downstream Nigeria Using Machine Learning and Geospatial Techniques (2018–2024). Discov. Geosci. 2025, 3, 76.
Oborie, E.; Fatunmibi, I.; Otutu, A.O. Shoreline Change Assessment in the Orashi River, Rivers State, Nigeria, using the Digital Shoreline Analysis System (DSAS). Sumerianz J. Sci. Res. 2023, 6(4), 70–77.
Mogo, C.F.; Agbabiaka, C.O.; Bamiekumo, B.P.; Mogo, C.O. Geospatial Mapping and Monitoring of Sandbars in the Forcados River: Implications for Sustainable Blue Economy in the Niger Delta. J. Geogr. Environ. Earth Sci. Int. 2025, 29(8), 106–127.
Amos, M.D.; Opukumo, A.W.; Winston, A.G. Geospatial Assessment of Drainage Density and Infiltration Characteristics in Coastal Catchments of Southern Nigeria. J. Geogr. Environ. Earth Sci. Int. 2025, 29(10), 79–97.
Oseji, S.; Chukwuemeka, P.; Imoni, O. Artificial Intelligence in 3D Printed Concrete: Sustainability Assessment and Implementation Challenges. J. Mater. Sci. Res. Rev. 2025, 8(2), 515–528.
Chukwuemeka, P.; Kyrian, O.; Imoni, O. Leveraging Machine Learning for the Identification of Obfuscated JavaScript in Phishing Attacks. Asian J. Res. Comput. Sci. 2025, 18(6), 301–314.
Akajiaku, U.C.; Ohimain, E.I.; Olodiama, E.E.; Eteh, D.R.; Winston, A.G.; Chukwuemeka, P.; Otutu, A.O.; Bamiekumo, B.P.; Imoni, O. Identifying Suitable Dam Sites Using Geospatial Data and Machine Learning: A Case Study of the Katsina-Ala River in Benue State, Nigeria. Earth Sci. Inform. 2025, 18(3), 497.
Abaye, E.O.; Ayowei, A.H.; Akajiaku, U.C.; Eteh, D.R. Implication of Landscape Changes Using Google Earth Historical Imagery in Yenagoa, Bayelsa State, Nigeria. Sumerianz J. Sci. Res. 2022, 5(1), 20–31.
Jonathan, L.E.; Imoni, O.; Chukwuemeka, P.; Eteh, D.R. Impact of Oil Spills on Mangrove Ecosystem Degradation in the Niger Delta using Remote Sensing and Machine Learning. J. Geogr. Cartogr. 2025, 8(2), 11707.
Molua, E.; Udo, A.; Okon, I. Hydrological Regimes and Ecosystem Services of the Niger Delta Basin. Water Resour. Clim. J. 2024, 15(2), 112–127.
Imoni, O.; Jonathan, E.L. Data-Driven Assessment of Soil Heavy-Metal Contamination in Joinkrama, Rivers State, Nigeria using Pollution Indices and Multivariate Analytics. J. Mater. Sci. Res. Rev. 2025, 8(3), 628–643.
Adekola, O. The Niger Delta Wetlands: Overview of Current Knowledge and Future Research Needs. Int. J. Biodivers. Sci. Ecosyst. Serv. Manag. 2011, 7(3), 182–194.
Edo, F.; Albrecht, T. Wetland Dynamics and Hydrological Processes in the Niger Delta. Wetlands Ecol. Manag. 2021, 29(5), 641–655.
Nwankwoala, H.O.; Okujagu, C. Wetlands and Coastal Resources of the Niger Delta: Potentials, Challenges and Prospects. Afr. J. Ecol. 2021, 59(4), 895–908.
Aziz, A.; Okechukwu, E.; Sanni, M. Hydrological Connectivity and Water Resources of the Lower Niger Basin. J. Geosci. Environ. Prot. 2019, 7(3), 54–69.
Tombra, E.P.; Adeigbe, O.C. Channel Morphology and Bank Erosion along the Nun River, Niger Delta. J. Geogr. Environ. Earth Sci. Int. 2019, 22(4), 1–13.
Adejuwon, J.O. Rainfall Seasonality in the Niger Delta, Nigeria. Afr. J. Environ. Sci. Technol. 2012, 6(4), 199–209.
Balogun, E.E.; Odjugo, P.A.O. Climate Variability and Water Resources in the Niger Delta Region of Nigeria. Environ. Res. Commun. 2020, 2(9), 1–10.
United Nations Environment Programme (UNEP). Environmental Assessment of the Niger Delta; UNEP: Nairobi, Kenya, 2021.
Okafor, U.J.; Eze, C.N.; Adigun, A. Spatiotemporal Climate Dynamics in the Niger Delta: Temperature and Rainfall Trends. Environ. Earth Sci. 2024, 83(5), 1127.
Akajiaku, C.U.; Agbabiaka, C.O.; Imoni, O.; Chukwuemeka, P.; Eteh, D.R.; Amos, M.D. Predictive Modeling of Iron Concentration in Groundwater using Machine Learning Techniques: A Case Study in Part of Yenagoa, Bayelsa State. J. Comput. Syst. Appl. 2025, 2(1), 1–11.
Folk, R.L.; Ward, W.C. Brazos River Bar, a Study in the Significance of Grain-Size Parameters. J. Sediment. Petrol. 1957, 27(1), 3–26.
U.S. Geological Survey. Landsat Collection 2 Product Guide; USGS: Reston, VA, USA, 2020.
Ashouri, H.; Hsu, K.-L.; Sorooshian, S.; Braithwaite, D.K.; Knapp, K.R.; Cecil, L.D.; Nelson, B.R.; Prat, O.P. PERSIANN-CDR: Daily Precipitation Climate Data Record from Multisatellite Observations. Bull. Am. Meteorol. Soc. 2015, 96, 69–83.
Google LLC. Google Earth Pro; 2023.
Blaschke, T. Object-Based Image Analysis for Remote Sensing. ISPRS J. Photogramm. Remote Sens. 2010, 65(1), 2–16.
Blaschke, T.; Hay, G.J.; Kelly, M.; Lang, S.; Hofmann, P.; Addink, E.; Feitosa, R.Q.; van der Meer, F.; van der Werff, H.; van Coillie, F.; Tiede, D. Geographic Object-Based Image Analysis – Towards a new paradigm. ISPRS J. Photogramm. Remote Sens. 2014, 87, 180–191.
McFeeters, S.K. The Use of the Normalized Difference Water Index (NDWI) in the Delineation of Open Water Features. Int. J. Remote Sens. 1996, 17(7), 1425–1432.
Cortes, C.; Vapnik, V. Support-Vector Networks. Mach. Learn. 1995, 20, 273–297.
Melgani, F.; Bruzzone, L. Classification of Hyperspectral Remote Sensing Images with Support Vector Machines. IEEE Trans. Geosci. Remote Sens. 2004, 42(8), 1778–1790.
Wu, C.; Ullah, M.; Lu, J.; Bhattacharya, J. Formation of Point Bars through Rising and Falling Flood Stages: Evidence from Bar Morphology, Sediment Transport and Bed Shear Stress. Sedimentology 2016, 63(6), 1458–1473.
Dubuis, R.; De Cesare, G. The Clogging of Riverbeds: A Review of the Physical Processes. Earth-Sci. Rev. 2023, 239, 104374.
Jonathan, L.E.; Winston, A.G.; Chukwuemeka, P. Machine Learning and Morphometric Analysis for Runoff Dynamics: Enhancing Flood Management and Catchment Prioritization in Bayelsa, Nigeria. J. Comput. Syst. Appl. 2025, 2(2), 1–16.
Muzahid, C.; Popy, S.; Islam, R.; Emon, M.; Reja, M.; Rahman, M.; Hoque, J.; Rabbani, M.; Raiyan, S. Quantifying River-Bank Erosion and Accretion Patterns along the Gorai River in Kushtia, Bangladesh: A Geospatial Analysis Utilizing GIS and Remote-Sensing Techniques. J. Geogr. Inf. Syst. 2024, 16, 70–88.
Rowley, T.; Konsoer, K.; Langendoen, E.J.; Li, Z.; Ursic, M.; Garcia, M.H. Relationship of Point Bar Morphology to Channel Curvature and Planform Evolution. Geomorphology 2021, 375, 107541.
Bryant, G.; Miall, A. Diverse Products of Near-Surface Sediment Mobilization in an Ancient Eolianite: Outcrop Features of the Early Jurassic Navajo Sandstone. Basin Res. 2010, 22(4), 578–590.
Gupta, S.; Ojha, C.S.; Singh, V.P. Linkage between Morphological Parameters and Erosion Rate Based on RUSLE for the Prioritization of Sutlej Catchment. J. Irrig. Drain. Eng. 2024, 150(4).
Li, J.; Wang, G.; Song, C.; Sun, S.; Ma, J.; Wang, Y.; Guo, L.; Li, D. Recent intensified erosion and massive sediment deposition in Tibetan Plateau rivers. Nat. Commun. 2024, 15, 722.
Dalrymple, R.W.; Rivers, J.M. A New Look at Modern Carbonate Shoals and Coastal Barrier Systems. Earth-Sci. Rev. 2023, 246, 104553.
Vázquez-Tarrío, D.; Fernández, R.; Menéndez-Duarte, R. Morphometric Characterization of River Meanders and Point Bars in the Atlantic Region of Spain using Drone-Based Photogrammetry. Geomorphology 2024, 453, 109185.
Bankert, A.R.; Nelson, P.A. Alternate bar dynamics in response to increases and decreases of sediment supply. Sedimentology 2018, 65(3), 702-720.
Bernatek-Jakiel, A.; Poesen, J. Subsurface Erosion by Soil Piping: Significance and Research Needs. Earth-Sci. Rev. 2018, 185, 1107–1128.
Bosino, A.; Mandarino, A.; De Amicis, M.; Cazzini, F.F.; Abu El Khair, D.; Flores, P. Assessment of Piping-Sinkhole Development in a Fluvial-Terrace Scarp Retreat Environment: A Multi-Temporal Analysis on the Lower Ticino River (Italy). Geomorphology 2024, 450, 109082.
Wang, H.; Bi, N.; Saito, Y.; Yang, Z. Changes in Sediment Load and Deltaic Response of the Yellow River to Climate Change and Human Activity. Earth Surf. Process. Landf. 2020, 45(5), 1239–1255.
Hooke, J.M. Morphodynamics of Active Meandering Rivers Reviewed in a Hierarchy of Spatial and Temporal Scales. Geomorphology 2023, 439, 108825.
Maju-Oyovwikowhe, E.; Olowu, O. Grain Size Analysis and Depositional Environments of Sediments from Well XY-04: Implications for Sand Control in the Reservoir. J. Appl. Geosci. Environ. 2023, 27, 153–168.
Li, Z.; Wang, Z.; Pan, B.; Zhu, H.; Li, W. The development mechanism of gravel bars in rivers. Quat. Int. 2014, 336, 73–79.
Greenberg, E.; Ganti, V. The pace of global river meandering influenced by fluvial sediment supply. Earth Planet. Sci. Lett. 2024, 634, 118674.