
Various methods for recognizing and detecting fake banknotes have recently become a major concern in finance and business. Fake detection is an increasingly important approach due to the significance and technological complexity of quickly and accurately processing large amounts of banknote image data, presenting a significant opportunity for data exploration. A proposed deep CNN technique utilized a detection method to distinguish between real and fake banknotes. This is achieved by examining the computer vision features of digital content to detect banknotes using smartphone cameras in a cross-dataset environment. The banknote detection model begins with preprocessing steps: image acquisition, size normalization, grayscale conversion, and histogram equalization. The processed grayscale image is fed into an Input Layer (zero parameters), followed by 14 Convolutional Layers and two Fully Connected Layers. This architecture, designed to reduce computational complexity and enable hardware deployment, results in a significantly smaller model than the VGG19 baseline (which has a million parameters). The customized model achieves high performance despite the parameter reduction, demonstrated by its impressive results on the dataset split into 80% training, 10% validation, and 10% testing datasets. After an iterative experimental process, the proposed model achieved 99.9% training accuracy, 99.4% validation accuracy, and 97.6% testing accuracy.
The financial industry is undergoing a rapid digital transformation, demanding more sophisticated and autonomous transaction facilities. Currency Recognition (PCR) plays a critical role in automating transaction facilities by using advanced features that require a sophisticated, deep automatic fake currency detection system [1,2]. Central to this evolution is Paper Currency Recognition (PCR), an intelligent pattern recognition technology that has become the backbone of modern self-service devices such as Automated Teller Machines (ATMs) [3,4]. In the Ethiopian context, this involves the complex task of identifying and verifying the specific context of 50, 100, and 200 Birr banknotes. By analyzing a multifaceted array of properties, including tactile textures, precise dimensions, color gradients, and unique symbolic shapes, PCR systems aim to seamlessly bridge the gap between physical currency and automated banking, ensuring that transactions are both efficient and user-friendly.
Despite these technological strides, the rise of high-resolution color printing, precision scanning, and advanced duplicating machinery has empowered the creation of sophisticated counterfeit banknotes that pose a severe threat to economic stability. Traditional verification methods, which often rely on a single factor for recognition, are increasingly inadequate against these high-quality physical copies. This creates a critical need for deep detection systems capable of extracting both visible and invisible security features. Because modern "fakes" can mimic basic aesthetics, researchers are now motivated to develop more robust, multi-layered deep learning models that can distinguish subtle discrepancies in banknote anatomy that escape the human eye, making the pursuit of foolproof verification a paramount concern for the industry. Thus, the distinction between counterfeit banknotes and real ones has become paramount. Researchers have proposed and deployed fake banknote recognition and verification based on a single factor of the existing banknotes [5].
The rapid modernization of the financial sector has introduced a critical dependency on Paper Currency Recognition (PCR) systems, particularly for Ethiopian denominations of 50, 100, and 200 banknotes. However, as printing and scanning technologies evolve, the industry faces a burgeoning threat from sophisticated counterfeits that mimic visible features with alarming accuracy. In Ethiopia, the current landscape is marred by a reliance on laborious, semi-automated, or manual verification methods that are inherently prone to human error and inefficiency, especially when processing large cash volumes. These systemic gaps lead to serious vulnerabilities, such as the accidental acceptance of counterfeit notes by ATM systems and the lack of accessible, portable tools for visually impaired individuals. For a developing economy, these failures do not merely represent financial losses; they also impede sustainable development and destabilize economic trust. It means that detecting fake banknotes is particularly challenging for nations grappling with diverse factors that impact economic activity and impede sustainable development [6].
Existing research has laid the groundwork for PCR by focusing on fundamental attributes such as symbols, texture, size, and color. Previous studies have successfully integrated these features into self-service devices to enhance transaction security. However, much of the related work in the field has historically relied on single-factor verification or traditional pattern recognition techniques, which often struggle to scale or adapt to the high-quality physical duplicates produced by modern scanners. While earlier models (e.g., [7,8]) established the feasibility of fake note detection, recent literature emphasizes that a more sophisticated, deep automatic approach is required to extract "invisible" features that traditional methods overlook. By building upon these foundational studies, there is a clear opportunity to transition from the limited, single-factor models of the past toward robust, multi-layered deep learning systems that address the specific environmental and economic challenges, underscoring the urgent need for a reliable, automated system to identify and detect counterfeit currency.
Banknotes incorporate a range of security features to prevent counterfeiting, including intaglio printing, watermark threads, security symbols, and UV features, with different denominations distinguished by their size and color [9]. The newly released Ethiopian banknotes also utilize these security elements [10,11]. Detecting counterfeit currency is a sophisticated process that leverages advanced image processing techniques, which involve preprocessing, analysis, and interpretation to enhance image quality and accurately represent the banknote [12]. Deep Convolutional Neural Network (CNN) algorithms, which use a multi-layered perceptron to analyze 2D image data, are particularly effective for this task [13,14]. These models are crucial for image interpretation, categorization, and recognition, helping to prevent counterfeit money from causing economic inflation [15]. This paper introduces an advanced, multi-faceted deep CNN model specifically designed to recognize and categorize the latest Ethiopian banknotes, thereby addressing the challenges associated with counterfeit currency. The contribution of this paper is summarized as follows.
- Introduced an advanced, multi-layered Convolutional Neural Network (CNN) specifically designed to address the unique complexities of the latest Ethiopian banknotes.
- Developed a system capable of extracting both visible and "invisible" security features, moving beyond traditional methods that rely on single-factor verification.
- Established a robust framework for Paper Currency Recognition (PCR) to enhance the security and autonomy of self-service devices like ATMs and bill-counting machines.
- Addressed critical systemic gaps by proposing a reliable, automated tool that facilitates currency verification for visually impaired individuals, thereby promoting economic inclusivity and trust.
- Optimize existing detection mechanisms and compare models to determine the most effective approach with innovative features.
The rest of the paper is organized as follows: Section 2 describes related works and discusses past techniques for detecting banknote fraud. Section 3 presents the methodology and proposed model. Section four details the experiment results and discussion. Section 5 includes the conclusion, future work, acknowledgments, and references.
Most previous studies on fake banknote detection largely concentrated on paper currency recognition and classification, including Ethiopian banknotes. Few of these studies have utilized deep learning-based detection methods [10,13,14,16, 17] for existing currency. However, those studies did not consider the newly proposed features of the released Ethiopian banknotes. We proposed a deep CNN model specifically designed for the new Ethiopian banknotes. Since each banknote has unique features, the deep CNN is used for fake detection [8,18]. Deep learning techniques in computer vision [7,19] focus on extracting and learning features in images using a sum (S) of kernel-generated elements and those (m, n) [11]. The traditional CNN functional model is typically represented as
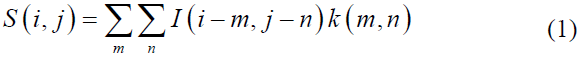
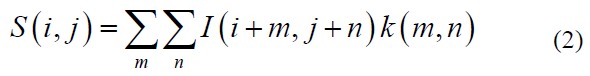
Where ‘I’ is the input image, ‘K’ is the applied kernel, ‘I’ and ‘j’ are the initial positions of the image at which the filter will begin operating, and m and n are the positions of the filter elements [3]. Fake detection, models for existing banknotes, such as those developed by [20] (2022), target frames and regions of inconsistency in local feature description. These models are limited to present the Minimum Detection Classifier (MDC) cross-correlation-based matching or correlation coefficient-based classifiers [21] as shown in Equation 2. For example, [22] (2019) uses a currency characteristic comparison for CNN-based feature extraction. This method breaks down image-rich content into distinct features with varying classification abilities. A unique banknote image processing method is applied as a classifier to construct a recognition system for detecting fake banknotes in a sequential deep neural network incorporating data augmentation [15,23].
These features and local feature descriptors in a four-level classification process known as correlation coefficient-based template matching classification. To detect counterfeit currency, a deep CNN classifier is employed to develop and train a counterfeit banknote detection model [2,24]. Using basic image processing techniques, [10] (2018) applied a Support Vector Machine (SVM) to distinguish Ethiopian banknotes from the large datasets. SVM is essential for optimizing the decision surface between the two classes in small datasets; however, for large-scale data, SVM can be time-consuming. [25] applied deep learning-based Single Shot Detector (SSD) and CNN models to extract features of paper money, allowing examination of both sides of the currency [12,26].
In image processing, several steps are taken to design an image classification and object recognition system to enhance the detection of counterfeit banknote images [27,28]. Image processing effectively identifies paper edge, color, and size using real-scene images collected from a scanner [29-31]. The detection model performance varies depending on the classifier used. Recognizing counterfeit currency depends on the data sets and algorithms used in the research [32,33]. Image processing is a technique that operates on the input image to produce a high-quality image.
Fake banknotes are counterfeit paper currency created without government authentication, typically for fraudulent purposes. Counterfeiting has existed since the inception of money, involving the illegal production of banknotes [34,35]. Counterfeiters create fake banknotes by replicating various security features, including those intended to be perceived by touch, to deceive the public and defraud businesses [36]. Once an image is captured using a mobile camera or scanner and preprocessed for quality enhancement, the extracted distinctive attributes are used for pattern matching and cross-correlation with existing datasets. This process involves multiple currency classification techniques based on image processing methods that key characteristics such as color, size, texture, and portraiture to effectively identify counterfeit banknotes [6,37].
This study uses a design science research methodology to propose a deep CNN model, and the approach entails the creation of new ideas that define concepts, practices, technological capabilities, and detection performance. The proposed deep CNN model has two fully connected layers, two output layers, fourteen convolution layers, and five fully connected layers with Max-pooling, Sigmoid, Batch normalization, dropout (2.0), ReLU (rectified linear unit), and flatten layers, as shown in Figure 1. Using the fully connected layer and the network's entire convolutional basis, we trained the model using 365,986 parameters. We resized the image to (224 * 224) grayscale and provided it as network input, indicating that the matrix was shaped by (224, 224). The model employed a 3×3 kernel with a stride of 2 pixels, covering the entire banknote image. Max pooling is considered using a 2×2-pixel window with a 2-slice size. The suggested model's convolution layers with a (3 × 3) receptive field and ReLU activation function traverse through the input image [9].
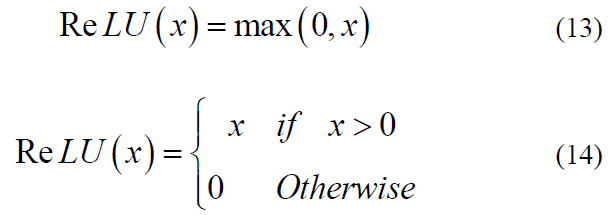
The input image is captured using a smartphone camera, and the data is pre-processed in a sequence of steps to enhance the detection result using a deep CNN model that classifies as real or fake. For CNN classifiers, the input (banknotes were cropped from the original input image based on the bounding box detection [19]. The three 3×3 convolutional layers in the model have spatial padding of the same size and a stride of 2. It employs max-pooling with a window size of 2×2 and a stride of 1 after every three successive convolution layers. The proposed model uses the Rectified Linear Unit (ReLU) activation function, which performs a threshold operation that sets all negative input values of the feature map to zero. We utilized ReLU to accelerate model training, improve generalization, and streamline calculations. We deploy a deep CNN with low computing power, minimal deployment time, and limited hardware resources. It aims for only two classes, as shown in Figure 1. The proposed banknote detection model utilizes a zero-parameter Input Layer for grayscale images, feeding into a feature extractor consisting of 14 Convolutional Layers utilizing Rule Activation to introduce non-linearity. This robust feature map extraction stage is designed with a reduced parameter count to minimize computational complexity compared to larger VGG19 models, aiding in more efficient hardware deployment and training. After the final convolutional layer, the output is flattened and classified by two Fully Connected Layers (two 64-neuron dense layers and a final 2-neuron layer) that use a Sigmoid classifier to yield the final probabilities for the banknote's class for binary classification.
As shown in Figure 1, the proposed model has three core components, and the detailed contexts are: (i) Input layer: the input layer accepts grayscale Banknote images of size 224×224 with two classes (real and fake), and the input to the first convolution layer is without any computation. The number of parameters in this layer is 0 because there are no learnable features. (ii) Convolutional layer: 14 convolutional and two fully connected layers. It is also the output layer. The first layer of the model filters the 224×224×1 input image using 32 kernels with a filter size (3×3) with a stride of 1 pixel. (iii) Fully Connected layer: At this level, the model performs in two dense layers, including the output layer. The first two dense layers each have 64 neurons, and the output layer has two neurons (binary classification). Following the fourteenth convolutional layer, the output is flattened into a one-dimensional vector and fed into the first dense layer. This layer processes the flattened data to compute class scores based on the number of neurons. Finally, the output layer, consisting of two neurons with a sigmoid activation function, yields the binary classification result. This architecture is specifically designed for binary classification tasks.
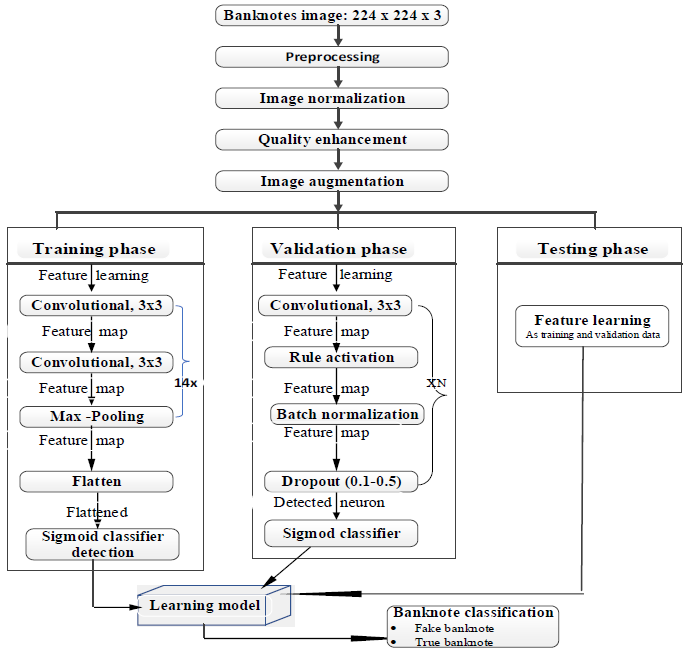
Figure 1. Proposed Fake Banknotes Detection Model Architecture.
Classifier design plays a crucial role in pattern recognition by seeking to identify the underlying model that generated the observed patterns. The specific techniques we used are directly determined by the characteristics of the models we evaluated. In digital image analysis, the classification procedure involves the numerical properties of various image features and then categorizes data into one of the classes based on homogeneous characteristics. Digital image processing (DIP) is a foundational component of pattern recognition that operates on arrays of numbers obtained by sampling points of a physical image. Its goal is the automatic or semi-automatic extraction of data, measurements, or information from the image [38]. Feature construction (or Feature Engineering) involves discovering missing relationships among existing features and augmenting the feature space by creating or inferring additional, informative features. In contrast, feature extraction aims to derive a new, smaller set of informative features from the initial measured data using functional mapping, thereby reducing the dimensionality of the feature space.
Digital images are represented in computer vision and expressed in vectors when digital image processing is involved, as presented in an N×N matrix. This step prepares data for layers that require a 1D format, such as fully connected layers in a neural network. The n-dimensional vector then transforms into a one-dimensional vector by placing the rows of pixels in the image one after the other in sequence, as shown in Eq. 3:
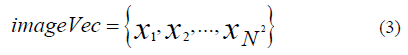
The first N elements starting from x1 to ꭓN refer to the first row of the image, followed by the next n elements referring to the second row of the image, and so on. A large image matrix can be constructed to represent the class similarities among 20 sample images. Each image is first converted into a corresponding image vector as the basis for the matrix. The dimensionality challenges are reducing the image space to a subspace of a smaller dimension while retaining as much appropriate information from the original images as possible. The principal component analysis (PCA) is an approach to addressing challenges. In statistics, PCA is a practical method simplifying a multi-dimensional dataset to a lower dimensionality for analysis or visualization.
In this research, the integrated pipeline for banknote image preprocessing and model training is centered around a robust Convolutional Neural Network (CNN) architecture, as illustrated in Figure 1. By autonomously refining raw image data and learning multi-level spatial features, this deep learning framework enables high-accuracy classification within complex environments [39]. While the CNN excels at capturing high-level semantic information and scene-level context, we introduce a hybrid framework known as Complementary CNN and Scale Invariant Feature Transform (SIFT) (Complementary CNN and SIFT) (CCS). The SIFT descriptors are fused with the CNN features at the final stage, after both have been independently processed into feature vectors, typically via concatenation. Applying SIFT feature extraction to M-channel images by calculating gradient orientation histograms for every pixel. By defining a local N x N neighborhood based on a dominant scale and partitioning it into a 3 x 3 grid of 8-bin histograms, we generate a rotation-invariant representation that preserves spatial dimensions while encoding robust local statistics [40,41].
This multi-level fusion strategy is designed to optimize security results for the financial sector by simultaneously fusing scene-level, object-level, and point-level contents. By merging the global feature-learning capabilities of CNNs with the precise local descriptors of traditional computer vision, the model creates a comprehensive digital fingerprint of the currency that is significantly more difficult for counterfeiters to replicate. To address the specific nuances of Ethiopian currency, the model leverages SIFT to capture local feature strengths that deep networks might otherwise generalize. SIFT is particularly essential for extracting and verifying intricate identification marks, such as the numeric indicators, the governor's signature, and the reflective golden vertical strip. The strength of the SIFT technique lies in its ability to generate feature descriptors that remain invariant to image rotation, scaling, and minor fluctuations in lighting or viewing direction—conditions common in real-world smartphone captures. This process involves a rigorous four-stage pipeline: scale-space extrema detection to identify potential interest points, key point localization to discard low-contrast points, orientation assignment to achieve rotation invariance, and a final node description that captures the local gradient distribution. This granular level of detail ensures that even the most subtle discrepancies in banknote anatomy are detected, providing a foolproof verification system.
Scale-space extrema detection is used to identify potential key points within an image by analyzing features across multiple scales. This can be applied to banknote images to help determine their authenticity. In this process, the image is blurred at different scales to detect scale-invariant features, which requires a difference of Gaussian (DoG) analysis using the input image data (blurred images). The DoH process requires different-sized space extrema at different scales, and it is calculated with a constant multiplicative factor k. The optimal sigma value for the Gaussian blurred banknote gains for both the real and fake banknote components. Let the scale-space define as L (x, y, σ) as the convolution operator (*) from a Gaussian kernel variable G(x, y, σ), and the input image I(x, y), and the mathematical model is defined as
The parameter σ is the scale of the key point, and the standard deviation of the Gaussian function is given as:
The difference-of-Gaussian Function D (x, y, σ) is calculated from the difference of Gaussians of two scales by a factor k, and given as:

The local extrema values are the reference point to differentiate the two classes of the banknote (real and fake), where the local maxima and minima of D (x, y, σ) of core points are computed to see the difference between the sample real and fake banknote images. The SIFT (Scale-Invariant Feature Transform) algorithm employs a cascaded filtering approach, where feature extraction techniques are applied to identify stable candidate key points across multiple scales. By utilizing a Difference-of-Gaussian (DoG) function, the system evaluates potential interest points at varying contrast and edge thresholds to ensure only the most robust features are retained. The core point's gradient and magnitude are prominent for the image region detection by building a histogram of gradient orientations q(x, y) weighted by the gradient magnitudes m(x, y) from the nearby features. The SIFT technique for local descriptors is the discrimination of the detected key point features. The local image gradient scale is measured in the region of the input image.
3.1. Data Source and Data Type: Banknote Image Data
Bank transactions are disrupted by fake banknotes, which are physical copies of the original banknotes with identical security features. The majority of large sums of money must be identified visually to operate the frequent yield change detection, necessitating the development of a practical solution to address this issue. It required a method to distinguish between real and fake banknotes. The proposed deep CNN model is utilized to enhance the performance of phony banknote detection. We also employed pre-trained MobileNetV2 and VGG19 for performance compression with the same dataset. We applied transfer learning methods to the pre-trained model. The data collected from the Commercial Bank of Ethiopia for 100s and 200s of real and fake banknotes. The banknote image data is annotated as Figure 2a-d of Ethiopian paper currency (Birr) [42].
3.2. Data Preprocessing
Banknote recognition is intelligent pattern recognition, and the corresponding digital image processing enhances image quality, image acquisition, pre-processing, feature extraction, dimensionality reduction, and classification decision tasks [27]. Image pre-processing aims to boost banknote properties essential for the fake banknote detection model and improve image quality by suppressing unwanted distortions. Image acquisition is obtaining an image with the help of hardware-based sources, such as a digital camera or scanning equipment. Then, the simple pre-processing procedure is implemented on the enhanced images. It is an advanced image pre-processed for a succession of complex image-processing methods, including feature extraction and dimensionality reduction for further image analysis. Then, the classifier analyzes the numerical properties of various image features and the data in categories.
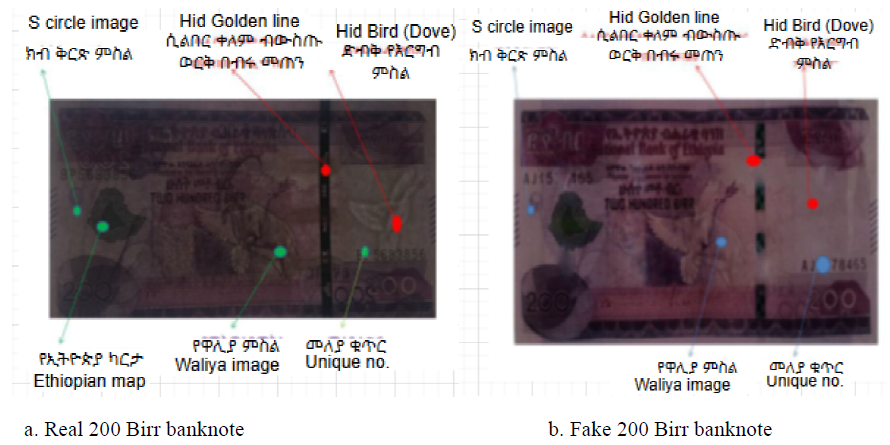
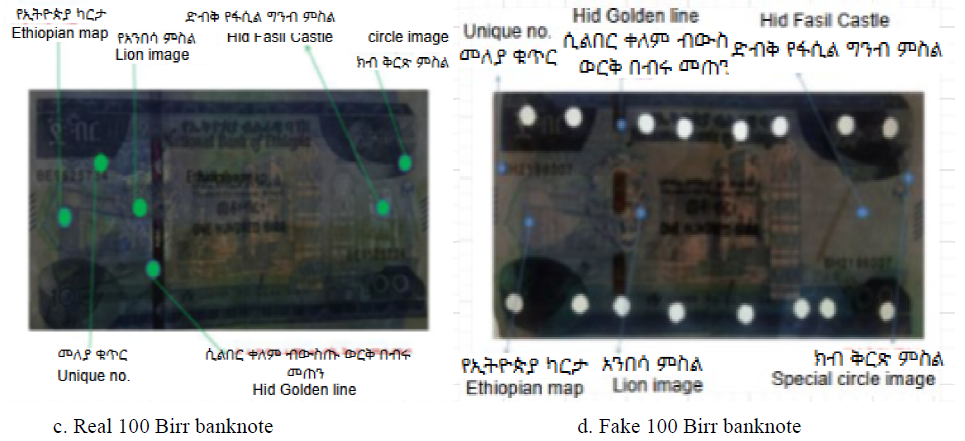
Figure 2. Ethiopian banknotes and their corresponding watermarks.
Banknote image processing extracts key information from the image, transforming it into a more sophisticated representation. This processed information facilitates subsequent image classification tasks, enabling the categorization of banknotes into distinct classes during the recognition stage. The deep learning algorithm learns distinct features of the image from the image's raw pixels. It performs explicit preprocessing on the dataset by building CNN models from scratch [29]. In this phase, we preprocessed the data to prevent issues with size normalization, color (RGB to gray) scale conversion, and Histogram equalization.
3.3. Image Size Normalization
To reduce computational load, banknote images captured via smartphone and scanner were down-sampled at a ratio of 2:1. These images were then resized to a uniform 224 × 224 pixels to standardize the scale features across different denomination sizes. To identify the banknote, we developed an algorithm-based model to detect and train data for context subtraction and perspective correction in Adaboost currency recognition. A portable tool was designed to identify fake monetary accounts based on visual cues. As a result, image size normalization minimizes the computational time inconsistency of input data [43]. These steps help us improve accuracy and address overfitting issues. Once the dataset is prepared for detection using the proposed model, the input data is trained to test the model.
3.4. RGB to Grayscale Conversion
To streamline data processing and enhance computational efficiency, this study employs a grayscale conversion as a foundational preprocessing step. While simpler techniques often derive grayscale values by averaging the three RGB color channels, this approach can fail to account for human perception and varying light intensities. Consequently, we utilize the luminosity method to transform original RGB images into grayscale versions that preserve essential intensity information. To assign specific weights to each color channel based on their respective wavelengths, as detailed by [44]. This method ensures that the model captures a more accurate representation of the banknote’s structural features. This weighted conversion, defined in Eq. 7, optimizes model performance by reducing data dimensionality while maintaining high-fidelity contrast across different denominations.

In computer vision, image intensity is fundamentally representative of the light reflected or refracted from a surface. Following the methodology established by Saravana et al. (2022), the transformed intensity I is derived from the original input Iij to preserve critical visual data. This research utilizes a specialized weighting scheme for grayscale conversion, specifically adopting the coefficients 0.17R + 0.62G + 0.21B. By favoring a significantly higher weight for the green channel (.62) and an elevated blue weight (0.21) compared to the standard Rec. 601 (BT.601) benchmarks, the process is tailored to highlight the unique intensity features inherent in banknote designs. These color ratios are essential for maximizing detection precision and model accuracy. An iterative process of color combination, which involves minimizing red channel contributions and strategically balancing green levels relative to the red and blue components. A grayscale representation is produced that enhances the visibility of discriminative textures. As demonstrated in Figure 2, this fine-tuning results in a more visually coherent and feature-rich image, providing a superior foundation for the model’s subsequent feature extraction layers.
In the context of digital image processing for banknote authentication, the alpha (α) channel serves as a critical component beyond mere color representation; it defines pixel transparency and opacity independent of the primary RGB values. To optimize performance on 8-bit systems, our methodology employs fixed-point integer arithmetic to handle these channels, effectively replacing computationally expensive floating-point multiplications. This mathematical approach is vital for accurately modeling the interaction between the medium and light. The pixel values within our dataset are intrinsically linked to the physical properties of the banknote paper, including the refraction, absorption, and reflection coefficients that characterize its unique material features. To bridge the gap between these physical parameters and their digital representations, we specifically focused on the watermark texture and other distinctive statistical features. These observed reflection patterns serve as proxies for the underlying banknote parameters, allowing the system to distinguish between denominations and identify counterfeits based on subtle differences in material density. To facilitate a more granular analysis, we partitioned each banknote image into six distinct spatial blocks, as illustrated in Figure 3. This localized approach ensures that feature-related parameters are captured with high spatial precision. Consequently, the derivative image computational model, which integrates these light-interaction coefficients, is formulated as follows:
As shown in Figure 3, the localized nature of this approach ensures that feature-related parameters are captured with high spatial precision, preserving the intricate details necessary for fine-grained analysis. By isolating specific regions of the banknote, the system can effectively map light-interaction coefficients to the physical texture of the paper. These parameters are then integrated into the derivative image computational model, which serves as the foundational framework for analyzing light distribution across the banknote surface. This relationship is mathematically formalized in the following equation:
The correlation between color channels is a critical factor in reconstructing a full-color image from its grayscale counterpart. This reconstruction process is merely a visual restoration; it is a vital step in establishing the spectral relationships required to distinguish between authentic and counterfeit banknotes. By precisely quantifying the red, green, and blue components that correlate with single-channel grayscale intensity, the model effectively recovers the spectral information typically lost during grayscale conversion. As defined in Eq.10, this mathematical formulation serves as the computational core of the system, identifying the most discriminative color correlation or magnitude to ensure reliable and robust banknote authentication, and it is formulated as follows:
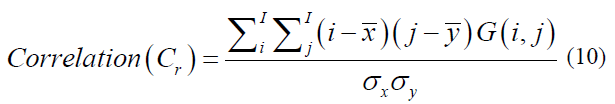
Where the mean represents the calculated average of the sums derived from each column within the square matrix, providing a central measure for vertical data distribution. And the mean serves as the mean value for the sums of all elements contained within each row, reflecting the horizontal central tendency. To quantify the dispersion of these values, the standard deviations (𝝈𝒙) (sigma {x} and (𝝈𝒚) (sigma_{y} are employed; these represent the variability among the column sums and row sums, respectively, indicating how much the individual totals deviate from their established means.
This is the product-moment correlation coefficient (or Pearson correlation coefficient). The value of r always lies between -1 and +1. A value of the correlation coefficient close to +1 indicates a strong positive linear relationship (i.e., one variable increases with the other; Figure 2). A value close to -1 indicates a strong negative linear relationship (i.e., one variable decreases as the other increases; Figure 3). A value close to 0 indicates no linear relationship (Figure 4); however, there could be a nonlinear relationship between the variables (Figure 5).
Figure 3. Grayscale Banknote Image.
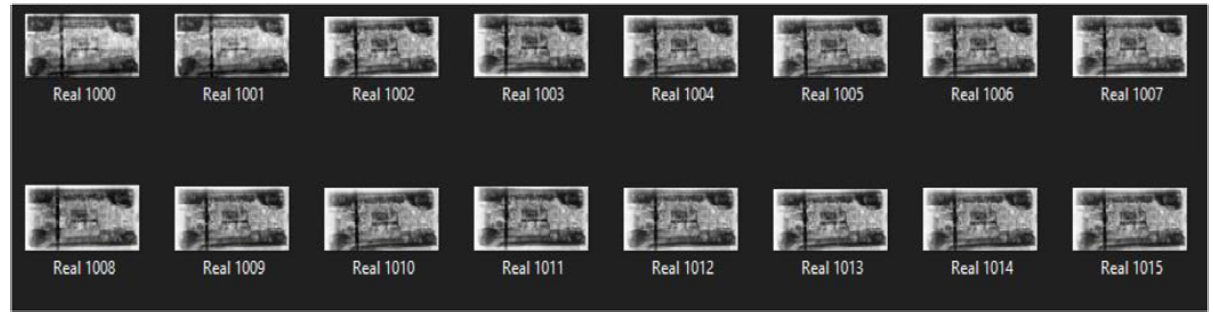
Figure 4. Banknote Image after Histogram Equalization.
3.5. Image Quality Enhancement
The image quality enhancement process is a critical step in maintaining the original quality and informational content of banknote data, a necessary challenge in paper money transactions, which suffer from wear and tear. Over time, factors that degrade the color, texture, and integrity of circulating banknotes can lead to issues such as incorrect currency usage and increased processing time. To effectively mitigate this degradation and improve the visibility of crucial security features, Histogram Equalization (HE) is systematically employed. This method is vital because experimental studies have shown that recovering various essential banknote features from darker grayscale images is challenging, making HE a necessary prerequisite to enhance the success of subsequent feature extraction and modeling, as shown in Figure 4.
As shown in Figure 4, Histogram Equalization (HE) operates by modifying the image's pixel values to increase contrast through the more even distribution of intensity levels, essentially adjusting the contrast to improve the image's visual clarity. By performing this enhancement, HE ensures that the banknote security features—such as the watermark latent features and the golden strip- become significantly more discernible and easier for the system to utilize. This improved visibility is fundamental to the crucial task of reliably distinguishing between authentic and counterfeit banknotes, thereby strengthening the overall authentication process.
3.6. Data Augmentation
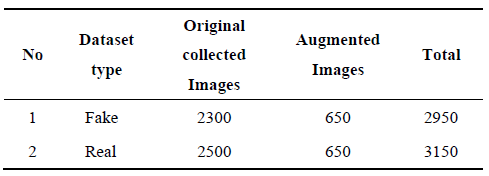
To achieve a high accuracy rate in the training process, particularly when utilizing Convolutional Neural Network (CNN) architectures, data augmentation techniques were systematically implemented to generate a sufficiently large and diverse dataset from the initial input data, as noted by [45]. Banknote images captured in real-world scenarios exhibit significant variability due to differences in the camera's zoom, resolution, and angle. All of which can negatively impact the robustness and generalizability of the model's performance. Therefore, augmentation methods, including random rotation and shifting (as a baseline), alongside the techniques zoom, horizontal flip, and Gaussian blur, were specifically applied to improve the dataset's diversity and resilience against such variations as summarized in Table 1.
Table 1. Summary of data augmentation.
3.7. Data Partition
Data partitioning is a critical initial step in model development, involving the segmentation of the dataset into three distinct subsets: training, validation, and testing. Typically, the data is divided with 80% allocated for training, 10% for validation, and the remaining 10% for final testing. The training set serves as the core foundation where the model is repeatedly exposed to data over multiple epochs to learn underlying characteristics. When working with image data, this process often requires additional preprocessing within the partitions, such as resizing, normalization, or data augmentation to ensure the model learns spatial hierarchies and pixel-level features effectively. The validation set remains a separate subset used exclusively to evaluate performance during training, guiding the adjustment of hyperparameters and preventing the model from overfitting to the specific visual patterns in the training images.
To enhance evaluation robustness, particularly for limited datasets, K-fold cross-validation is frequently employed; however, this paper utilizes a structured approach where the validation set remains a separate, distinct subset used exclusively to monitor performance during the training process. While standard K-fold methods involve rotating through k equal-sized folds to ensure that every data point contributes to both training and validation, thereby ensuring a stable statistical profile, this study prioritizes a dedicated validation partition to guide hyperparameter adjustment and select the optimal model version. This validation step is essential for assessing effectiveness before the final testing set, which is held back entirely until training is complete, is utilized to provide a definitive, unbiased verification of the model’s generalized performance on pristine, unseen data.
The banknote image data are composed of denominations of Ethiopian Birr notes, including 50, 100, and 200 Ethiopian Birr banknotes collected from the Commercial Bank of Ethiopia, which is chosen based on the counterfeiting frequency rate value. We captured a total of 6100 (3150 genuine and 2950 fake) image data. The proposed deep CNN model's performance is verified using 100 and 200-denomination banknotes, as shown in Figures 2, 3 & 4, and Table 2 for selected banknote denominations. The images are taken in different directions and backgrounds.
4.1. Feature Extraction Using Deep CNN
Feature extraction demands various requirements and a dynamic computational effort for pattern design. It is an extractable measurement for symbolism or shape, numerical (such as width, length, height, and watermarks), or both of a banknote. Within a Deep Convolutional Neural Network (CNN), the features of an object are represented by continuous, discrete, or discrete-binary variables. These variables fundamentally signify the presence or absence of specific contexts or characteristics within the input data (Shivam et al. 2020). Before performing detection, the fourteen convolutional layers utilized to categorize the banknote pictures carry out feature extraction. The CNN model automatically learns various characteristics taken from the input image during training.
The CNN-based feature extractor is a fourteen-layer convolutional network designed to extract local features from the input image. This architecture utilizes layers that contain learnable kernels (filters), and it incorporates five max-pooling layers, Batch Normalization layers, and the ReLU activation function throughout its structure [45]. We use 3x3 filters in the convolution layer. We use a filter slide from left to right in one direction of the banknote image to extract and learn the various banknote features. At the time of banknote feature extraction, each convolution layer accepts pixel values of the banknote image. Those pixel values are multiplied by 3x3 filter values, which gives the feature map output. It contains learnable patterns to identify the given banknote image.
The Banknote features map includes patterns from the provided banknote image. ReLU activation functions are passed through each value of the feature map [18]. The recovered feature map is sent to the Max pooling layer, which lowers the feature map's resolution and the CNN network's computational cost. The convolution layer, ReLU activation function, Batch normalization, and Max pooling layers are similar processes that make up the feature extraction method [22] that uses a banknote picture as an input, as shown in Figure 5.
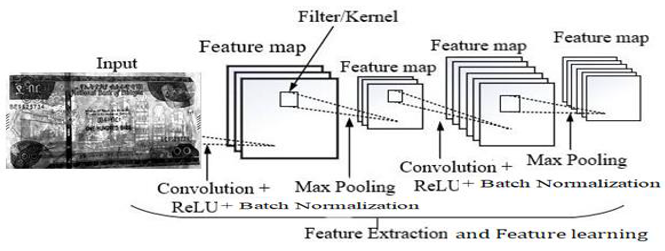
Figure 5. Banknote Feature extractions process flow model
As shown in Figure 5, the convolution layer processes the input data using a feature detector on the image to compute the total products in each location. The convolution on the input image is executed to generate feature maps of the input image's size and filter number to determine the number of strides and padding. The batch normalization technique is applied for training data, deep NN standardizes the inputs to a layer for each mini-batch, and stabilizes the learning process to reduce the number of training epochs required to train deep networks, as of Eq. 11:
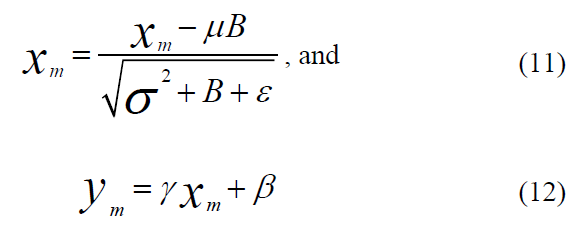
Where ꭓm is the input, and m[1, 2, …, M] Is the mean of the input values, Is the variance of input values, and ɛ is a small positive number. Gama () and Beta () are the two parameters gained in the training process.
The ReLU is a reflective syndrome on the convolution process that we use to replace the negative values with zero to insert nonlinearity into a feature map, and it is computed as
Pooling, a down-sampling technique in convolutional neural networks (CNNs), reduces the spatial dimensions of feature maps generated by the ReLU activation function. Max pooling achieves this by iteratively selecting the maximum value within local regions of the feature map, yielding a compressed representation of the most salient information. This process is applied iteratively across the feature map, resulting in a reduced representation that retains the most important information. To convert the two-dimensional matrix into a vector, we conduct a flattening layer for the best compatibility and insertion of neural networks for classification decisions that follow the full connection (FC) layer to learn the feature from the previous steps for image classification [46].
4.2. Real and Fake Banknote Detection in the Proposed CNN Model
The fully connected (FC) layer performs the detection process. Primarily, the model classifies the input image based on the features extracted by the preceding fourteen convolutional layers. The proposed model incorporates two FC layers, with the output layer being the second. The first FC layer receives input from the convolutional layers, pooling layers, and the flattening layer. Before reaching the FC layer, the flattening layer transforms the 2D output from the convolutional and pooling layers into a 1D vector, representing the grayscale image features associated with each class. Figure 6 illustrates the detection process within the network's FC layer.
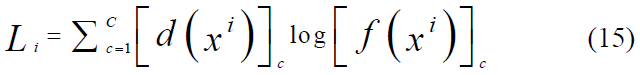
As shown in Figure 6, the goal of FC is to define the number of outputs, which is proportional to the target classes. The proposed deep CNN works to classify the entered images into several categories based on the features extracted from the previous layers. The input images are entered through training, and the neural network uses backpropagation and the transformation process for input classification to a probability distribution over classes. In this case, the cross-entropy function works from side to side with the softmax function and is considered the better option after listing the softmax function. This function has measured the difference between a probability distribution of the output of the softmax function f(x) and the desired distribution d(x). Loss (L) of class number (C) is calculated as Eq.15.
4.3. Performance Metrics for Model Evaluation
To validate the model’s performance, statistical metrics are employed to compare predicted outputs against ground-truth objects. Following established methodologies [47-50], we utilized accuracy, precision, recall, and the F1-score metrics, particularly well-suited for binary classification and detection tasks. While the training dataset was used for model optimization, the validation and testing sets provided an unbiased assessment of performance. Throughout the training phase, we monitored accuracy and loss curves across epochs to track convergence. Finally, the trained Convolutional Neural Network (CNN) was rigorously evaluated using the independent testing dataset, which remained unseen during training, to generate a comprehensive suite of results, including a confusion matrix and final accuracy/loss figures. To explore a metric performance for multi-class classification systems presented in Eqs. 16-19.
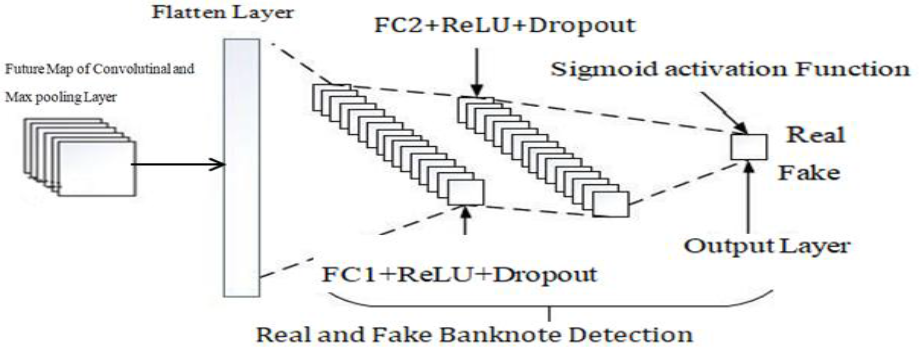
Figure 6. Real and Fake Banknote Detection in the proposed CNN model.
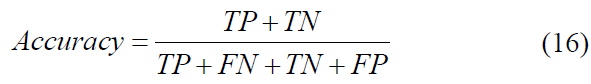
where TP is true positive, FP is false positive, TN is true negative, and FN is false negative. Precision represents the proportion of correctly identified positive instances relative to all labeled instances as positive by the model. Using TP (true positives) and FP (false positives), this percentage is calculated as follows:
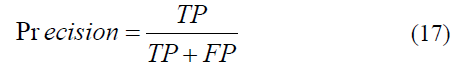
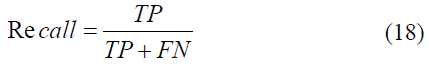
A higher precision indicates a lower likelihood of false positives, effectively reducing the probability that a negative observation is incorrectly classified as positive. Sensitivity, commonly referred to as recall, quantifies the model's ability to identify true positive observations relative to the actual total of positive instances. This metric is vital in scenarios where minimizing false negatives is a priority. While recall measures the percentage of successful detections (true positives), the remaining portion of actual positive data incorrectly projected as negative constitutes the false negative rate, which is defined as follows in Eq. 18
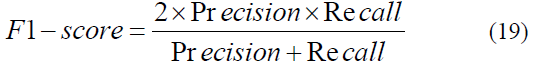
The F1-score serves as the harmonic mean of precision and recall, providing a balanced assessment of a model's performance for a specific positive class. Rather than a simple arithmetic average, this metric penalizes extreme values, ensuring that a high score is only achieved when both precision and recall are robust. This makes the F1-score particularly valuable in scenarios involving imbalanced datasets, where focusing on a single metric might lead to a misleading evaluation of the system's predictive power. The consolidated relationship between these two components is mathematically represented in Equation 19.
4.4. Experiment and Evaluation
4.4.1. Data Preparation
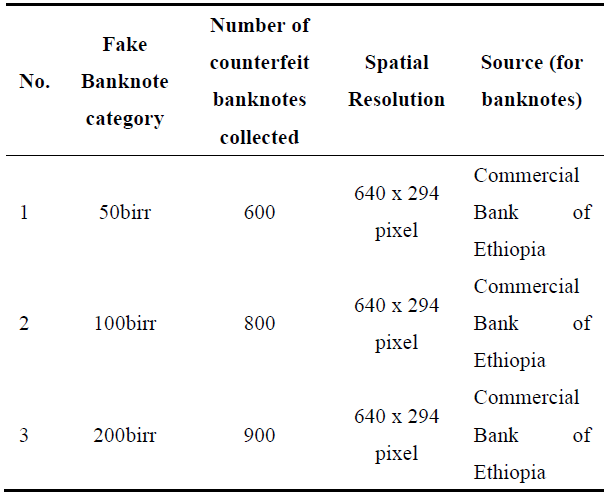
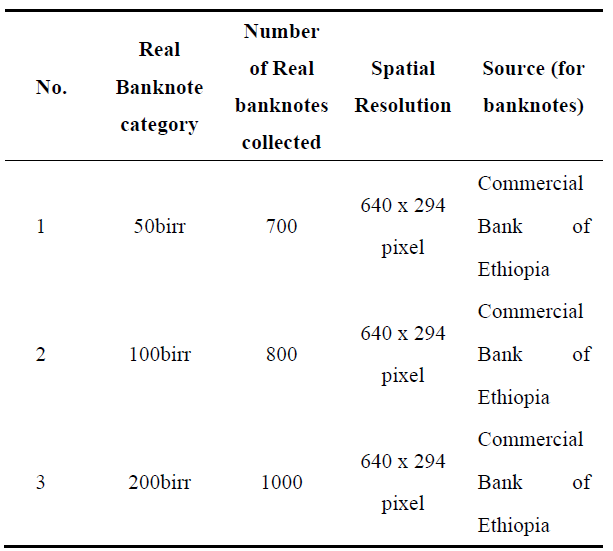
Sufficient data for training a CNN model necessitates a deep learning algorithm-based data processing approach. To evaluate and test our proposed model, we utilized a dataset of 4800 images (2500 genuine and 2300 counterfeit banknotes), encompassing banknotes in new, slightly used, old, and worn-out conditions. We use Weiner's adaptive filtering methods for each band (RGB) of the banknote. To maintain the integrity of banknote (image) features, we employed pixel mean and variance estimations for both clean and dirty banknotes, as detailed in Eqs. 20 and 21. Images were captured using a smartphone with 16 Megapixels and processed at a resolution of 200 DPI (Dots per Inch), with a size of 640 x 294 pixels, and saved as JPG files. All real and fake banknote images were acquired against a white light background. The dataset comprises distinct categories of genuine and counterfeit banknotes, as outlined in Tables 2 and 3.
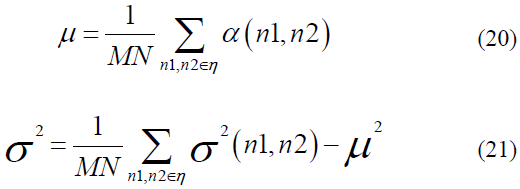
Alpha () represents the N by M neighborhood for each pixel in the image, and Wiener filtering is given as:
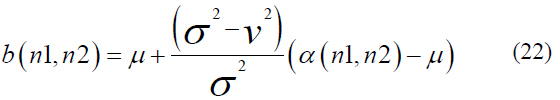
Image noise variance (v) to omit the Wiener filter considers the average of all local variances.
Table 2. Collected the Fake Banknote dataset category.
The training data was digitized into images for computer processing, with 200 and 100 samples per denomination. These data were acquired through different methods: using a scanner and a digital camera.
4.4.2. Experimentation Environment
In this research, the model training and evaluation are implemented using TensorFlow and Keras API, which needs to be configured in a Windows 10 (OS) environment. All the preprocessing, training, and testing tasks were done on a Lenovo laptop with a Processor Intel(R) Core(TM) i3-7020U CPU @ 2.30GHz, 2304 MHz, 2 Core(s), 4 Logical Processor(s), and 4 GB RAM running Windows 10 operating system. This experimentation has three scenarios: the first scenario describes the result analysis of the proposed model, the second scenario presents the result analysis of the pre-trained CNN model, and the third scenario describes the result analysis of the MobileNetV2 model.
Table 3. Collected the real banknote dataset category.
4.4.3. Training the Proposed Model
We evaluated the proposed model with different learning rates(0.01,0.001,0.0001) and two train-test split ratios(80/10/10 and 70/15/15) that can affect the performance of the network model. As shown in Table 4, when we use the 80/10/10 dataset proportion of training, validation, and testing, we obtain high performance on the loss value, training accuracy, and validation accuracy value, so we use the training data to increase the performance of the CNN model. Besides this, in the 70/15/15 dataset ratio, the training data is smaller, and the test dataset is higher compared to the 80/10/10 dataset ratio. So, the performance we obtained on the 70/15/15 dataset ratio is smaller in the loss value, the training accuracy, and the validation accuracy than the 80/10/10 dataset ratio. Our experimental result has shown that increasing the training dataset. It is possible to train, validate, and test performance.
As shown in Table 4, the number of epochs represents the repetitiveness of the entire dataset passes both forward and backward through the neural network. For this study, we conducted a rigorous baseline analysis by training the model across a spectrum of epochs ranging from 3 to 10. These observations revealed a significant sensitivity to this parameter; utilizing too few epochs resulted in underfitting, while excessive epochs led to a substantial divergence between training and validation loss. We determined the optimal baseline of 10 epochs by pinpointing the exact convergence point where the model achieved peak accuracy before the onset of overfitting. This iterative experimentation allowed us to identify the "sweet spot" in the learning curve, ensuring that the model captures the underlying patterns of the data rather than simply memorizing the training samples.
To further mitigate the risk of overfitting and bolster the model’s generalizability, we integrated a robust suite of regularization techniques alongside our optimized epoch schedule. We implemented data augmentation to increase sample diversity, complemented by weight decay, dropout layers, and batch normalization. Furthermore, the network architecture was streamlined to reduce the number of trainable parameters, fostering a more stable and efficient learning process. As illustrated in Figures 7 and 8, the validation accuracy consistently remained competitive with, and often surpassed, the training accuracy for a clear indicator of a well-regularized system. This was reinforced by an early stopping callback function that monitored loss values to halt training at the first sign of degradation. These combined efforts yielded exceptional performance metrics, culminating in the training accuracy of 99.9%, validation accuracy of 99.4%, and a testing accuracy of 97.6%.
As illustrated by the confusion matrix in Figure 9, the proposed CNN model, utilizing an 80/10/10 data split, demonstrated a high level of accuracy on the testing dataset. Out of the 590 banknote images used for testing—comprising an equal number of 295 real and 295 fake banknotes—the model correctly identified 576. This resulted in only 14 images being misidentified, confirming the model's effectiveness in distinguishing between real and counterfeit currency.
Table 4. Result summary of the model on 80/10/10 and 70/15/15 dataset ratio.
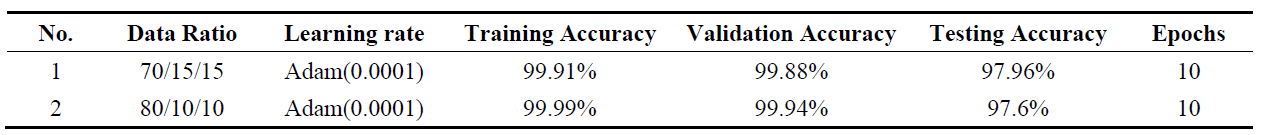
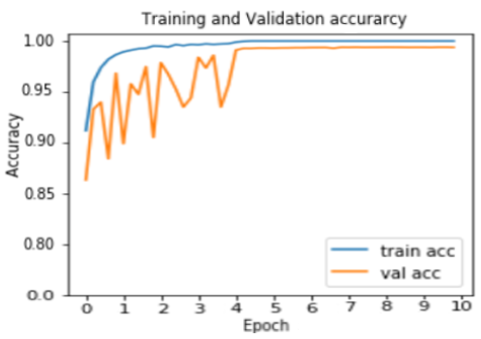
Figure 7. Proposed model Training and Validation Accuracy.
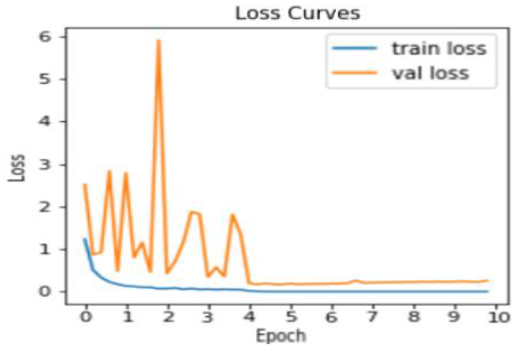
Figure 8. Proposed model Training and Validation loss.
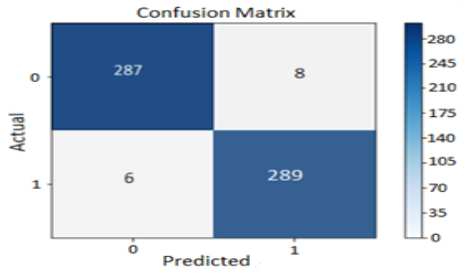
Figure 9. Proposed model Testing Confusion matrix.
4.4.4. Training the Pre-Trained VGG19 Model
To comprehensively evaluate the performance of the VGG19 Convolutional Neural Network (CNN) model, which was initialized with pre-trained weights, and the data set partitioning into distinct training, validation, and testing sets using an 80:10:10 ratio. The training process was strictly controlled using a consistent set of hyperparameters: specifically, 10 total epochs and a fixed learning rate of 0.0001. Upon completion, the fine-tuned, pre-trained VGG19 model demonstrated strong performance across all metrics. It achieved a near-perfect 99.80% training accuracy, indicating successful and thorough feature learning from the training data, and a high 96.55% validation accuracy, suggesting robust generalization capability beyond the training set, as shown in Figures 10 and 11.
Figure 10. VGG19 training and validation Accuracy.
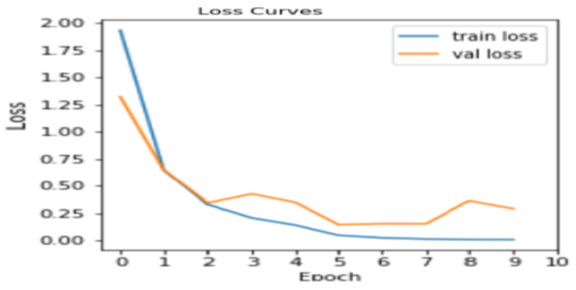
Figure 11. VGG19 Training and Validation Loss.
As shown in Figures 10 and 11, the unbiased measure of the model's performance was the testing accuracy, which was recorded at a strong level. This dynamic progression of training and validation results is generated and presented. These figures graphically illustrate the corresponding accuracy and loss curves of the pre-trained VGG19 model over the epochs, specifically tracking the training accuracy/loss and validation accuracy/loss metrics. This visualization clearly demonstrates the model's convergence behavior and its generalization characteristics throughout the training process at the specified learning rate. Figure 12 presents the confusion matrix for the pre-trained VGG19 CNN model, which was trained and evaluated using an 80:10:10 split of our dataset. Based on this ratio, our testing set comprised 590 banknote images, equally divided into 295 real and 295 fake banknotes. Our experimental results indicate that the model correctly identified 568 out of these 590 testing images, with 22 images being misclassified.
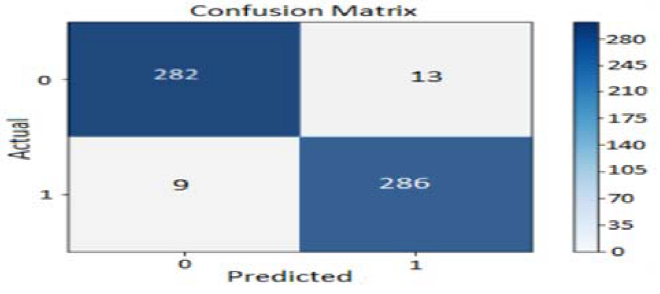
Figure 12. Pre-trained VGG19 model Testing Confusion matrix.
4.4.5. Training the Pre-trained MobilNetV2 model
To provide a robust benchmark and validate the performance of the proposed model, a comparative experiment was conducted using the pre-trained MobileNetV2 Convolutional Neural Network (CNN) architecture. This experiment was executed under strictly identical conditions to ensure a fair comparison: the model was trained using the same dataset split ratio (80% training, 10% validation, 10% testing), utilized the same, limited number of epochs (10), and maintained an identical learning rate (0.0001) as shown in Figures 13 and 14.
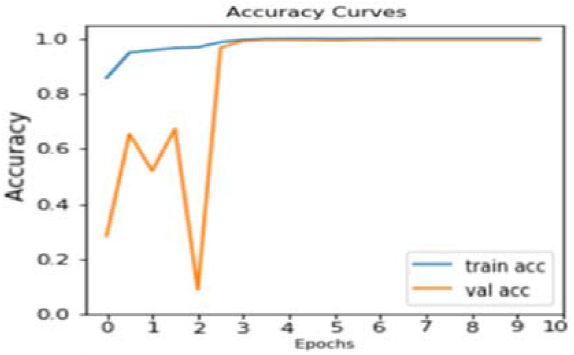
Figure 13. MobilNetV2 Model Training and Validation Accuracy.
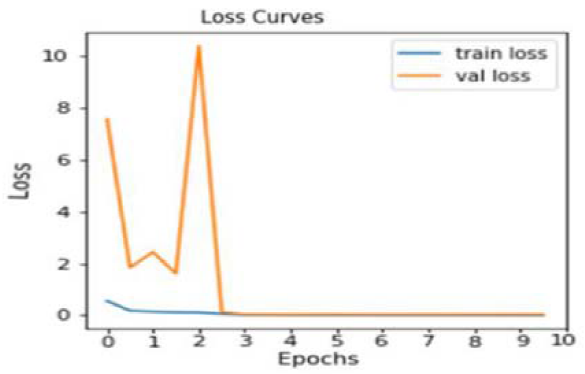
Figure 14. MobilNetV2 Model Training and Validation Loss.
As shown in Figures 13 and 14, the results of this performance check are thoroughly detailed in the subsequent figures: Figure 13 and Figure 14. These two plots specifically illustrate the accuracy and loss curves achieved by the MobileNetV2 model over the 10 epochs. The accuracy of tracking key metrics, including training accuracy loss and validation /loss, provides a clear visual representation of how effectively the MobileNetV2 model learned and generalized from the given dataset, providing a critical reference point against the performance of the newly proposed architecture. Figure 15 displays the confusion matrix for the pre-trained MobileNetV2 CNN model, evaluated on a testing set of 590 banknote images (295 real and 295 fake), resulting from an 80/10/10 dataset split. Our experiment reveals that the model correctly classified 573 images, with 17 misclassifications.
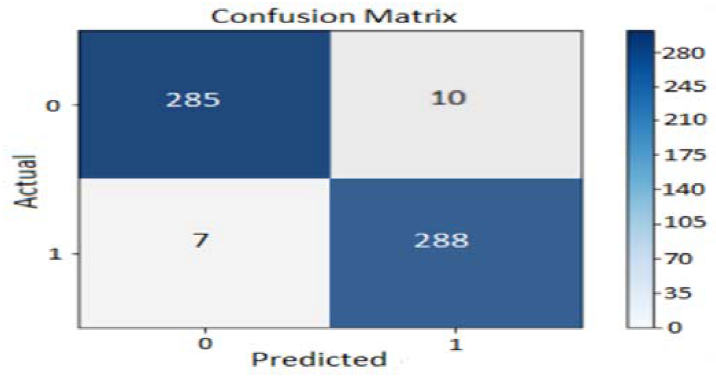
Figure 15. Pre-trained MobileNetV2 model Testing Confusion matrix.
4.4.6. Summarization of Experiment Result
The proposed detection and classification model is better than the previous CNN model's accuracy. It is characterized as (i) replacing the Soft-Max ReLu activation functions with Sigmoid (binary classification and MobileNetV2 design for multi-class problems). (ii) Detection parameter counts fewer compared to other pre-trained CNN models. (iii) Implementing a feature fusion technique. (iv) Down-sampling techniques, and (v) The proposed model, designed with our custom dataset in mind, demonstrates improved performance compared to other pre-trained CNN models. The proposed model automatically determines the optimal number of epochs using an early stopping mechanism. Furthermore, the training process is designed to halt upon the detection of new features within the dataset. For the pre-trained model, the number of training epochs was set to 10, which may be insufficient to fully leverage the feature extraction capabilities of the pre-trained CNN architecture. Additionally, while the proposed model employs an optimal learning rate determined through a trial-and-error approach (as shown in Table 5), the pre-trained CNN model utilizes a similar learning rate. This discrepancy in learning rate optimization may have adversely impacted the performance of the pre-trained model, as evident in Table 6.
As shown in Table 5, the results achieved in this study are the product of a rigorous iterative optimization process that carefully balanced the model's training duration by evaluating a wide range of epoch values. By systematically analyzing the performance at both minimal and maximal epoch thresholds. We were able to precisely identify and mitigate the risks of underfitting and overfitting, ensuring the model captured essential features without losing its ability to generalize. This meticulous attention to the "epoch baseline" and convergence behavior provides a level of methodological depth that distinguishes our proposed results from previous works, which often overlook these training dynamics. Consequently, our subsequent conceptual comparative analysis provides a high-fidelity evaluation, positioning the specific algorithmic configurations and datasets utilized in this experiment against existing state-of-the-art benchmarks to highlight the superior stability and accuracy of our approach.
4.4.7. Conceptual comparative analysis
This study is driven by a critical examination of the motives and existing research gaps within the field of counterfeit currency identification. As detailed in the second and third paragraphs of Section 1, a significant void exists regarding detection mechanisms for newly introduced banknote designs and the specific evolution of algorithms used in prior literature. Our analysis, summarized in Table 6, highlights several recurring limitations in previous works, most notably restricted dataset sizes, high computational complexity, and a failure to account for emerging security features in modern detection methods. To address these shortcomings, this paper proposes a novel detection framework for counterfeit banknotes leveraging advanced deep learning architectures designed to overcome the constraints of traditional methodologies.
Table 5. Result Summary.
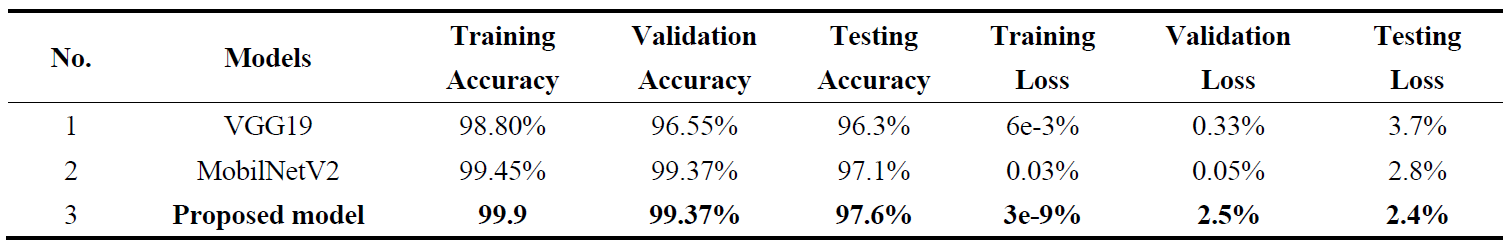
Table 6. Comparative analysis with existing related works.
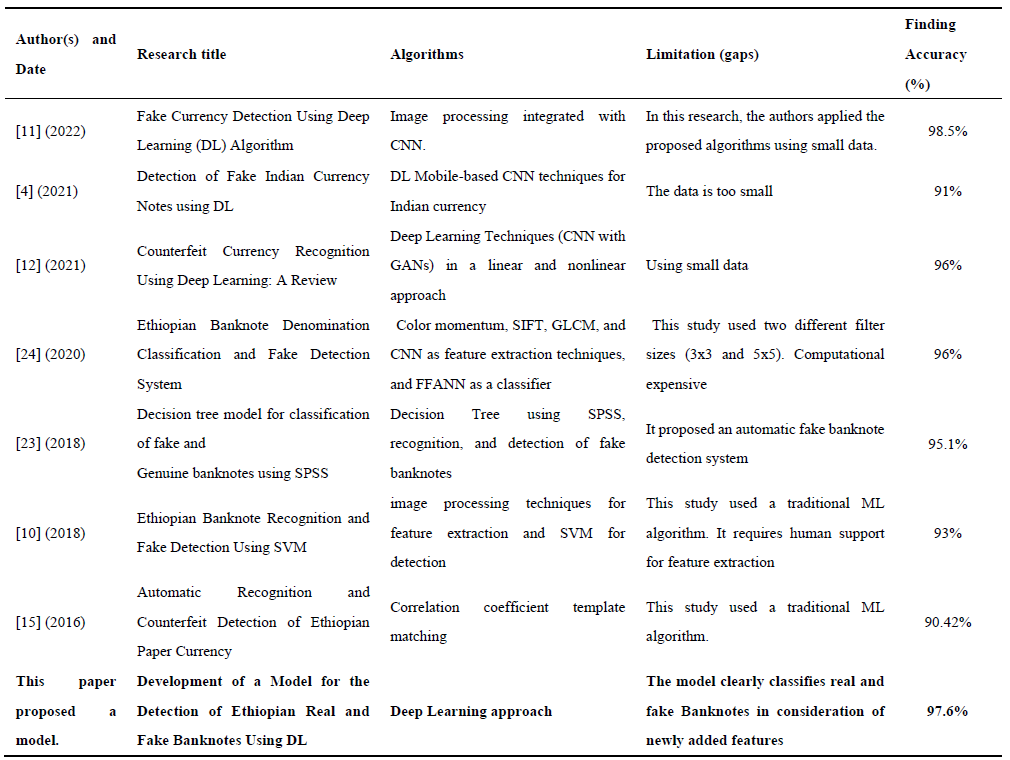
The synthesis of related literature presented in Table 6 serves to underscore the technical novelty and specific contributions of the proposed approach. By benchmarking our work against existing studies, we conducted a multidimensional comparative analysis on recent works, including their consideration, the integration of machine learning algorithms to augment deep learning (DL) applications, and the diversity of the underlying datasets. Unlike previous methodologies that often struggled with high latency or limited data variety, the current research leverages these synthesized insights to optimize model architecture. Consequently, this conceptual and empirical comparison demonstrates that by addressing the specific limitations found in prior works—particularly regarding feature augmentation the proposed model achieves significantly higher performance rates and greater robustness in detection.
By establishing a new benchmark in Ethiopian currency verification, this study demonstrates that customized deep learning architectures can significantly bolster the technical toolkit available for fraud detection, providing a robust defense against increasingly sophisticated counterfeiting methods. The novel performance of the modified VGG19 model, characterized by its dense hierarchical convolutional layers, underscores the critical importance of deep feature extraction when distinguishing subtle differences in intricate watermark symbols and paper texture quality. These findings suggest that high-accuracy fraud detection is achievable even with regional datasets of limited scale, provided the model architecture is meticulously tuned to the specific optical characteristics and security threats inherent to local currency. The primary contribution of this research lies in the introduction of an advanced, multi-layered Convolutional Neural Network (CNN) specifically engineered to navigate the unique complexities of modern Ethiopian banknotes. This work successfully developed a system capable of extracting both overt and covert security features, moving beyond traditional single-factor verification to a more holistic multi-dimensional analysis. To establish a robust framework for Paper Currency Recognition (PCR), this study bridges a critical systemic gap, offering a reliable, automated tool that enhances the autonomy of self-service devices such as ATMs and promotes economic inclusivity by assisting visually impaired individuals. The research also provides a rigorous comparative analysis of models, identifying the most effective algorithmic approach to optimize existing detection mechanisms with innovative, data-driven features.To transition these theoretical insights from a controlled experimental setting into a robust real-world utility, future research must prioritize the seamless integration of these deep learning algorithms into high-speed hardware environments, such as ATM intake sensors and automated bill counting machines found in commercial banking. Looking forward, expanding the dataset to include a dual-sided analysis of both the obverse and reverse faces of banknotes will be vital for a comprehensive security profile. Additionally, a key objective for future work is the algorithm’s resilience against "structural noise"—the physical degradation, creases, and staining found in heavily circulated or aged currency. Addressing these factors will be an essential step toward developing a field-ready detection system capable of maintaining high precision amidst the unpredictable physical conditions of daily commerce.
Author Contributions: Conceptualization, and methodology (G.B.G. and T.A.T.), software (T.A.T.); validation (G.B.G.), formal analysis (T.A.T.), investigation (G.B.G.), resources, and data curation (T.A.T. and D.W.G.), writing, original draft preparation (T.A.T.), writing, review and editing (G.B.G.); visualization (G.B.G., D.W.G., and T.A.T.); supervision (G.B.G.). All authors have read and agreed to the published version of the manuscript.
Funding: This research and the publication of this article were conducted without any financial support.
Data Availability Statement: The data are available from the corresponding author upon reasonable request. The code used in this study is available from the corresponding author upon reasonable request.
Acknowledgments: We thank the anonymous reviewers for their valuable comments and constructive suggestions. This research was conducted independently, without external funding from public, commercial, or not-for-profit sources. A preliminary version of this manuscript was posted as a preprint on Developing a Model for Detection of Ethiopian Fake Banknote Using Deep Learning | Research Square with the identifier https://doi.org/10.21203/rs.3.rs-2282764/v1.
Conflicts of Interest: The author has no conflicts of interest for the manuscript and its forthcoming publication process.
Naresh, K.S. A Novel Approach for Detection of Counterfeit Indian Currency Notes Using Deep Convolutional Neural Network. IOP Conf. Ser.: Mater. Sci. Eng. 2020, 981, 022018.
Sadyk, U.; Baimukashev, R.; Turan, C. State-of-the-Art Review of Deep Learning Methods in Fake Banknote Recognition Problem. Int. J. Adv. Comput. Sci. Appl. 2024, 15, 848–856.
Sarfraz, M.; Bux Sargano, A.; Ul Haq, N. An Intelligent System for Paper Currency Verification Using Support Vector Machines. Sci. Iran. 2019, 26(Special Issue), 59–71. DOI: 10.24200/sci.2018.20350.
Deshpande, S.K.; Chincholi, R.; Ayub, S. Detection of Fake Indian Currency Notes Using Deep Learning. Int. J. Res. Appl. Sci. Eng. Technol. 2021, 9, 1353–1359.
Behery, G.M.; El-Hadidi, H.H.; El-Harby, A.A.; Abd Usamad, S.T.M. Intelligent Libyan Banknote Recognition System. Intern. Res. J. Eng. Technol. 2021, 8, 1668-1680.
Hariharan, G.; Elangovan, D. A Survey On Techniques Used to Detect Counterfeits. Int. J. Sci. Technol. Res. 2019, 8, 790–793.
Pachón, C.G.; Ballesteros, D.M.; Renza, D. Fake Banknote Recognition Using Deep Learning. Appl. Sci. 2021, 11, 1-20.
Pushpa, R.N., Aditya Aithal, H.K., Ganesh Prasad, M., Divakar, M.R., Hithesha, H.G. Detection of Fake Currency Using Machine Learning. Int. J. Res. Appl. Sci. Eng. Technol. 2023, 11, 4415–4421.
Kamal, N.A.M.; Ramli, M.S.A.b. Counterfeit Malaysian Banknotes Detection Using Discrete Wavelet Transform. J. Posit. Sch. Psychol. 2022, 6, 8589–8598.
Tesfaw, E.A. Ethiopian Banknote Recognition and Fake Detection Using Support Vector Machine. In Proceedings of the International Conference on Inventive Communication and Computational Technologies (ICICCT), 2018; pp 1354–1359.
Anarse, M.; Chidrawar, A.; Kothavade, P.; Kardile, S.; Taksal, A. Fake Currency Detection Using Deep Learning: The Algorithm. Int. J. Adv. Res. Comput. Commun. Eng. 2022, 11, 685–690.
Ahmed, T.N.; Muhamad, S.S. Counterfeit Currency Recognition Using Deep Learning: A Review. Technium 2021, 3, 14–26.
Alene, A. S.; Meshesha, M. Ethiopian paper currency recognition system: an optimal feature extraction. IEEE-SEM 2019, 7, 2320-9151.
Jiao, L.; Wu, H.; Bie, R.; Umek, A.; Kos, A. Multi-Sensor Golf Swing Classification Using Deep CNN. Procedia Comput. Sci. 2018, 129, 59–65.
Zeggeye, J.F.; Assabie, Y. Automatic Recognition and Counterfeit Detection of Ethiopian Paper Currency. Int. J. Image, Graph. Signal Process. 2016, 8, 28–36.
Kumar, D.; Chauhan, S. Indian Fake Currency Detection using Computer Vision. Int. Res. J. Eng. Technol. 2020, 7, 2870–2875.
Berhane, Y.; Worku, A.; Bejiga, A.; Adamu, L.; Alemayehu, W.; Bedri, A.; et al. Prevalence and Causes of Blindness and Low Vision in Ethiopia. Ethiop. J. Health Dev. 2008, 21, 204–210.
Padmaja, B.; Naga Shyam Bhargav, P.; Ganga Sagar, H.; Diwakar Nayak, B.; Bhushan Rao, M. Indian Currency Denomination Recognition and Fake Currency Identification. J. Phys.: Conf. Ser. 2021, 2089, 012008.
Kumar, D.; Chauhan, S. Indian Fake Currency Detection using Computer Vision. Int. Res. J. Eng. Technol. 2020, 7, 2870–2875.
Balasubramanian, S. B.; Prabu, P.; Venkatachalam, K.; Trojovský, P. Deep-Fake Detection Using Cascaded Deep Sparse Auto-Encoder for Effective Feature Selection. PeerJ Comput. Sci. 2022, 8, e1040.
Singh, S.; Tiwari, A.; Shukla, S.; Pateriya, S. Currency Recognition System Using Image Processing. Int. J. Eng. Appl. Sci. Technol. 2020, 5, 539–542.
Patil, H.; Deshmukh, S.; Aglave, S.; Gawali, P.S. Fake Currency Detection Using Deep Learning. J. Emerg. Technol. Innov. Res. 2022, 9, 401–403.
González, R.E.; Munoz, R.P.; Hernández, C.A. Galaxy Detection and Identification Using Deep Learning and Data Augmentation. Astron. Comput. 2018, 25, 103–109.
Shefraw, A.A. Deep Learning Approach for Ethiopian Banknote Denomination Classification and Fake Detection System. Int. J. Comput. Sci. Control Eng. 2020, 7, 30–37.
Zhang, E.H.; Jiang, B.; Duan, J.H.; Bian, Z.Z. Research on Paper Currency Recognition by Neural Networks. In Proceedings of the International Conference on Machine Learning and Cybernetics, Xi'an, China, 2003; Vol. 4, pp 2193–2196.
González, R.E.; Munoz, R.P.; Hernández, C.A. Galaxy Detection and Identification Using Deep Learning and Data Augmentation. Astron. Comput. 2018, 25, 103–109.
Deshpande, T. Detection of Counterfeit Currency of Rs. 2000 and Rs. 500 Using MATLAB. Int. J. Adv. Res. Comput. Commun. Eng. 2021, 10, 349–355.
Agasti, T.; Burand, G.; Wade, P.; Chitra, P. Fake Currency Detection Using Image Processing. IOP Conf. Ser. Mater. Sci. Eng. 2017, 263, 052047.
Eggert, C.; Herrlich, M.; Smeddinck, J.; Malaka, R. Classification of Player Roles in the Team-Based Multi-Player Game Dota 2. In Proceedings of the International Conference on Entertainment Computing; Springer: Cham, 2015; pp 112–125.
Aseffa, D.T.; Kalla, H.; Mishra, S. Ethiopian Banknote Recognition Using Convolutional Neural Network and Its Prototype Development Using Embedded Platform. J. Sens. 2022, 2022, 4505089.
Sarfraz, M. An Intelligent Paper Currency Recognition System. Procedia Comput. Sci. 2015, 65, 538–545.
Darade, S.R. Automatic Recognition of Fake Indian Currency Notes. In the 2016 International Conference on Electrical Power and Energy Systems, Madhya Pradesh, India, 14-16th December 2016.
Nagpure R.; Shetty S.; Ghotkar T.; Yadav C.; Kanojiya S. Currency Recognition and Fake Note Detection. Int. J. Innov. Res. Comput. Commun. Eng. 2016, 3659–3666.
Semary, N.A.; Fadl, S.M.; Essa, M.S.; Gad, A.F. Currency Recognition System for Visually Impaired: Egyptian Banknote as a Case Study. In 2015 5th International Conference on Information and Communication Technology and Accessibility (ICTA), Marrakech, Morocco, 2015; pp 1–6.
Youn, S.; Choi, E.; Baek, Y.; Lee, C. Efficient Multi-Currency Classification of CIS Banknotes. Neurocomputing 2015, 156, 22–32.
Zhang, Q.; Yan, W.Q. Currency Detection and Recognition Based on Deep Learning. In 2018 15th IEEE International Conference on Advanced Video and Signal Based Surveillance (AVSS), Auckland, New Zealand, 2018; pp 1–6.
Bengio, Y.; Haffner, P. Gradient-Based Learning Applied to Document Recognition. Proceed. IEEE 1998, 86.
Reddy, S. A.; Harsha Sai, V.S.; Ruby, D. Currency Note Authentication, Note Value Estimator Using NB Classifier, SVM by Matlab. Int. Res. J. Eng. Technol. 2021, 8, 1–10.
Heaton, J. Ian Goodfellow, Yoshua Bengio, and Aaron Courville: Deep Learning. Genet. Program. Evolvable Mach. 2018, 19, 305–307.
Yan, K.; Wang, Y.; Liang, D.; Huang, T.; Tian, Y. CNN vs. SIFT for Image Retrieval: Alternative or Complementary? In Proceedings of the 24th ACM International Conference on Multimedia, Amsterdam, The Netherlands, 2016; pp 407–411.
Tsourounis, D.; Kastaniotis, D.; Theoharatos, C.; Kazantzidis, A.; Economou, G. SIFT-CNN: When Convolutional Neural Networks Meet Dense SIFT Descriptors for Image and Sequence Classification. J. Imaging 2022, 8, 256.
Meshram, V.; Patil, K.; Chumchu, P. Dataset of Indian and Thai Banknotes with Annotations. Data Brief 2022, 41, 108007.
Veeramsetty, V.; Deshmukh, R.; Mohnot, A.; Singal, G. State of Art on Features Extraction, Recognition and Detection of Currency Notes. AIP Conf. Proc. 2022, 2418, 040012.
Huang, S.Y.; Mukundan, A.; Tsao, Y.M.; Kim, Y.; Lin, F.C.; Wang, H.C. Recent Advances in Counterfeit Art, Document, Photo, Hologram, and Currency Detection Using Hyperspectral Imaging. Sensors 2022, 22, 7308.
Diarra, A.; Tegawendé, F.; Poda, P. A Deep Learning App for Counterfeit Banknote Detection in the WAEMU. In Proceedings of the International Conference on Journal of Research and Innovation (JRI), Ouagadougou, Burkina Faso, Nov 24–26, 2022; pp 1–13.
Neethu, P.S.; Suguna, R.; Sathish, D. An Efficient Method for Human Hand Gesture Detection and Recognition Using Deep Learning Convolutional Neural Networks. Soft Comput. 2020, 24, 15239–15248.
Bre, F.; Gimenez, J.M.; Fachinotti, V.D. Prediction of wind pressure coefficients on building surfaces using artificial neural networks. Energy Build. 2018, 158, 1429–1441.
Guerra, R.d.T.; Yamaguchi, C.K.; Stefenon, S.F.; Coelho, L.d.S.; Mariani, V.C. Deep Learning Approach for Automatic Heartbeat Classification. Sensors 2025, 25, 1400.
Hornik, K.; Stinchcombe, M.; White, H. Multilayer Feedforward Networks Are Universal Approximators. Neural Networks 1989, 2, 359–366.
Schmidhuber, J. Deep Learning in Neural Networks: An Overview. Neural Networks 2015, 61, 85–117.