
Against the backdrop of digital-intelligence transformation and rapid industrial restructuring, traditional single-dimension indicators no longer capture the complexity of labor-market change. Focusing on IT graduates and drawing on 4,239 records, this study develops a five-dimension High-Quality Employment (HQE) assessment system encompassing income returns, stability, growth potential, person-job match satisfaction, and digital-intelligence capability. Dimension weights are learned via a random forest model. The HQE composite score shows a Pearson correlation of 0.7094 with an expert-rated criterion variable, indicating strong validity and robustness.
At present, a new round of technological revolution and industrial transformation is profoundly reshaping the basic structure and operating mechanisms of the labor market [1,2]. For workers in high-tech industries, employment quality has moved beyond single-dimension criteria such as wage level or employment form toward a comprehensive evaluation system that integrates multiple factors, including economic returns, occupational stability, development opportunities, and subjective work experience [3-5]. In high-skill industries represented by information technology, traditional employment-quality frameworks often struggle to fully capture rapid skill iteration, changing task structures, and the growing importance of digital capability and person-job alignment under digital transformation [6-8]. Against this background, clarifying and operationalizing High-Quality Employment (HQE) for IT graduates constitutes the core scientific problem this study seeks to address.
To address this problem, two research gaps need to be clarified. First, although existing employment-quality research has increasingly adopted multidimensional frameworks, its conceptualization remains insufficiently adapted to the IT sector. In particular, current approaches do not adequately capture the employment realities of IT graduates, whose labor-market outcomes are shaped by rapid skill iteration, strong role segmentation, and the rising importance of transferable digital capabilities. Second, while previous assessment systems have commonly relied on expert-based weighting methods such as AHP or Delphi, the use of data-driven approaches to identify the relative importance of employment-quality dimensions remains underexplored.
Against this background, this study makes three contributions. First, it develops an IT-specific HQE framework that integrates the core concerns of established employment-quality research with the occupational characteristics of the digital-intelligence era. Second, it introduces a data-driven weighting strategy based on Random Forest feature importance, thereby complementing conventional expert-judgment approaches with evidence derived from observed relationships in the data. Third, it provides an operationalized and empirically tested assessment framework that supports reproducible measurement and criterion-related validation in the context of IT graduates.
Accordingly, this study pursues two closely related objectives. The first is to define the conceptual connotation and hierarchical structure of HQE in the IT context and translate it into a set of observable and quantifiable indicators. The second is to construct and validate a composite scoring model under unified data-processing procedures, using Random Forest analysis to derive dimension weights and examining the criterion-related validity of the resulting HQE score. Through the full research chain of theoretical construction, operational definition, model building, and empirical testing, this study aims to provide a more context-appropriate and methodologically transparent framework for assessing high-quality employment among IT graduates.
Research on employment quality has evolved from single-dimension indicators to multidimensional, integrated evaluation systems [3,4,5,9]. Early studies focused on the differentiated effects of macroeconomic policy and industrial restructuring on employment quality; with the rise of the digital economy and deepening technological change, scholarly attention has increasingly shifted toward micro-level examinations of job content, occupational skills, and labor-market adaptability [1,2,10].
In terms of theoretical frameworks, the International Labour Organization’s concept of “Decent Work” catalyzed a shift from reliance on subjective job-satisfaction measures toward multidimensional assessments combining objective and institutional indicators [11-13]. Building on this line of research, subsequent studies further expanded evaluation dimensions to include job security, development opportunities, and broader social and organizational conditions [3,4,5,9,12,13]. Methodologically, the literature has also gradually extended from traditional statistical tools and expert-based weighting methods toward more integrative and data-driven approaches to employment-quality assessment [5,9,14-17].
Despite broad scholarly consensus that employment quality should be assessed through a multidimensional composite framework, operational definitions and measurement methods remain underdeveloped for specific industry contexts [3,4,5,9]. In the information-technology sector in particular, there is still a lack of precise conceptualization and standardized procedures concerning how to balance subjective perceptions of fit, objective labor-market returns, and digital-capability requirements within a unified HQE framework [6-9,18,19].
3.1. Conceptualization of HQE and Hierarchical Structure
Building on the foregoing review and industry-specific analysis, this study operationalizes High-Quality Employment (HQE) as the composite performance level—and its sustainable potential—of an individual’s employment status across multiple dimensions under specific industry contexts and occupational families, including economic returns, employment stability, growth potential, person-job fit, and core digital-intelligence capabilities.
The proposed framework is grounded in, and extends, established employment-quality theory. First, the dimensions of Economic Returns, Employment Stability, and Growth Potential are rooted in the classical concerns of the employment-quality and Decent Work literature, which consistently emphasize whether work provides adequate material returns, reasonable continuity and security, and opportunities for long-term development [11-13]. In this sense, these three dimensions capture the core objective foundations of employment quality for graduates entering the labor market.
Second, objective job conditions alone are insufficient for understanding employment quality in knowledge-intensive occupations. Drawing on Person–Environment fit theory, this study argues that employment quality also depends on the degree of congruence between individual capabilities, interests, and expectations, and the requirements and characteristics of the job environment [20-23]. This theoretical perspective supports the inclusion of Match and Satisfaction as a distinct dimension, operationalized through indicators that jointly reflect job-fit evaluation, subjective employment satisfaction, and mismatch signals.
Third, the digital-intelligence era requires a further extension of conventional frameworks in the specific context of IT graduates. For this group, digital-intelligence capability is not merely a background skill characteristic; it directly shapes access to employment opportunities, task performance, adaptability to technological change, and longer-term employability [6-8,18,19,24,25]. We therefore treat Digital-Intelligence Capability as an independent dimension of HQE, so that the framework can better reflect the skill structure and occupational realities of contemporary IT work.
Taken together, the five-dimensional framework retains the core concerns of established employment-quality research while extending them in two important ways: by incorporating subjective person-job congruence and by explicitly recognizing digital-intelligence capability as a context-specific pillar of employment quality in the IT sector [11-13,20-23].
Accordingly, we propose a second-order structural model with five first-order latent factors:
- Economic Returns: adequacy of wage income, including current income and entry salary.
- Employment Stability: continuity of employment and resilience to shocks.
- Growth Potential: career advancement channels and capacity-building space provided by the role and industry context.
- Match and Satisfaction: alignment between educational background and job requirements, combined with subjective work experience and satisfaction.
- Digital-Intelligence Capability: breadth and depth of core IT skills, including programming, data analysis, visualization, machine-learning modeling, deep-learning frameworks, and prompt engineering.
This dimensional scheme inherits core elements from classic employment-quality theory while explicitly strengthening capability requirements and subjective experience specific to the IT sector, thereby more precisely characterizing HQE among IT workers.
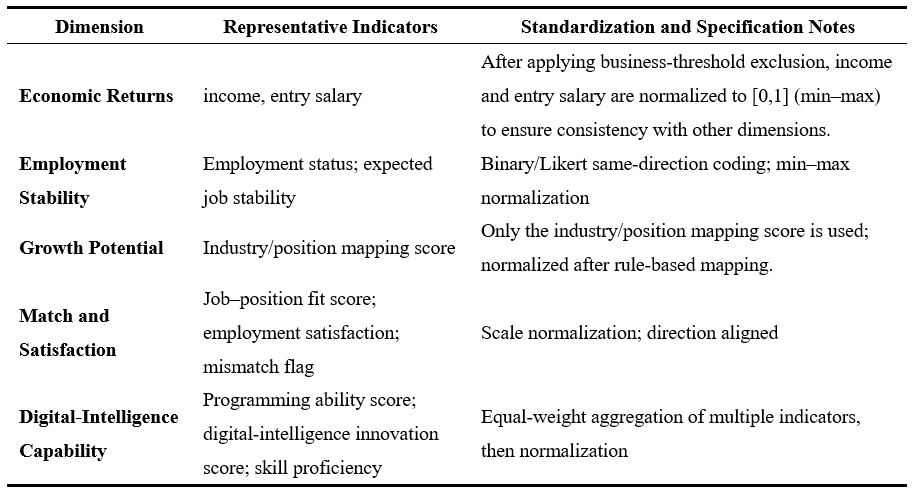
3.2. Measurement Indicators and Standardized Procedures
To ensure reproducibility and cross-sample comparability, all indicators are processed under a unified protocol. Specifically, we adopt a positive orientation (larger values indicate better performance) and apply [0,1] min–max normalization (extendable to a [0,100] percentage scale for select indicators), ensuring within-dimension and cross-dimension comparability and the validity of subsequent statistical analyses. The measurement indicators for each dimension and their standardization specifications are summarized in Table 1.
Table 1. Indicator Description List.
4.1. Basic Characteristics of the Study Sample
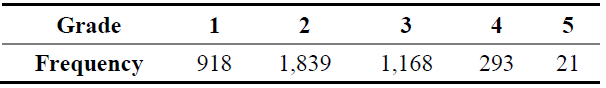
This study surveys graduates in information technology and related majors. After quality control, 4,239 valid observations were retained from an original pool of approximately 5,000. The employment-quality grade (levels 1–5) is used as an expert-rated criterion variable for model validation and validity testing. In terms of distribution, the employment-quality grades exhibit a typical long-tail pattern, with middle levels accounting for the majority of cases, while high-quality employment cases are relatively scarce—consistent with the stratified structure commonly observed in actual labor markets.
4.1.1. Employment-Quality Grade as the Criterion Variable
In this study, the employment-quality grade (levels 1–5) is used as the criterion variable for validating the HQE composite scoring model. This grade was assigned by seven experts on the basis of respondents’ questionnaire information. To reduce subjective bias, the experts evaluated the cases independently under a double-blind procedure, and the mean of the seven ratings was used to determine the final employment-quality grade.
As shown in Table 2, the distribution of the employment-quality grade exhibits a clear middle-concentration pattern: Grade 1 accounts for 918 cases (21.7%), Grade 2 for 1,839 cases (43.4%), Grade 3 for 1,168 cases (27.6%), Grade 4 for 293 cases (6.9%), and Grade 5 for 21 cases (0.5%). This distribution is broadly consistent with the stratified structure commonly observed in actual labor markets.
Importantly, this criterion was not mechanically computed from the weighted aggregation of the five HQE dimensions. Rather, it served as an expert-rated, non-composite criterion against which the multidimensional HQE framework could be evaluated. The key methodological point is that the subsequent Random Forest model does not predict a target that is algebraically derived from the same composite scoring formula. This design helps reduce circular validation and target leakage, and thus provides meaningful criterion-related evidence for assessing whether the proposed HQE framework captures the broader construct of employment quality.
4.2. Data Quality Control and Standardization Workflow
Data processing strictly follows a standardized quality-control protocol comprising the following steps:
Outlier detection and exclusion: At the variable level, hard deletions are applied to extreme outliers based on preset business-logic thresholds. For example, reasonable upper and lower bounds are imposed on compensation-related indicators, and observations beyond these bounds are removed. This step eliminates approximately 15.2% of the raw sample to ensure business plausibility and statistical robustness.
Direction alignment and normalization: For scale-based items, same-direction coding is first applied so that all indicators adopt positive scoring. Subsequently, [0,1] min–max normalization is performed (with some percentage indicators extended to [0,100]) to eliminate scale heterogeneity across indicators.
Dimension score aggregation: Within each dimension, indicators are aggregated via arithmetic averaging to produce a composite dimension score. This approach maintains computational simplicity while preserving informative heterogeneity across indicators.
This workflow ensures procedural consistency while maximizing the informational content and variance structure of the original data, thereby providing a reliable basis for subsequent statistical modeling and empirical analysis.
Table 2. Distribution of External Grades (N=4,239).
5.1. Within-Dimension Indicator Aggregation
After direction alignment and scale standardization, indicators within each dimension were aggregated using equal-weight averaging, so that each lower-level indicator contributed equally to the corresponding dimension score. The five dimension scores were computed as follows:
Economic Returns dimension score:

Employment Stability dimension score:

Growth Potential dimension score:

Match and Satisfaction dimension score:

Digital-Intelligence Capability dimension score:

where Sinc,Sstab, Sgrow,Smatch and Sdig denote the dimension scores for Economic Returns, Employment Stability, Growth Potential, Match and Satisfaction, and Digital-Intelligence Capability, respectively. incomescaled and entry_salaryscaled denote the standardized values of current income and entry salary.
employed is a binary indicator of current employment status (1=employed, 0=otherwise).and expected_job_stabilityscaled denotes the standardized score for expected job stability.
industry_position_mapping_score denotes the standardized score derived from the industry-position mapping and is used as the observed indicator of Growth Potential in the present study. job_fitscaled and employment_satisfactionscaled denote the standardized scores for perceived job fit and employment satisfaction, respectively.
mismatch_score denotes the reverse-coded mismatch indicator, such that higher values indicate better employment quality. In Eq. (5). skill_proficiencyi denotes the standardized score of the iii-th digital-intelligence skill item, where i=1,…,9. All dimension scores were constructed so that higher values indicate better employment quality.
Based on this, the standardized scores across the five dimensions for the IT graduate sample were statistically analyzed, with the results presented in Figure 1.
5.2. Dimension-Weight Optimization via Machine Learning
To determine the relative importance of the five dimensions in the HQE composite evaluation system, this study employs a Random Forest (RF) model, using the five dimension scores as predictors and the expert-rated employment-quality grade as the outcome. Feature-importance analysis is then used to obtain data-driven weights for each dimension [16,17,26].
This approach offers three advantages: (1) it effectively captures nonlinear relationships between dimensions and the criterion variable; (2) it identifies complex interaction effects among dimensions; and (3) it yields a weight ranking grounded in information gain [26].
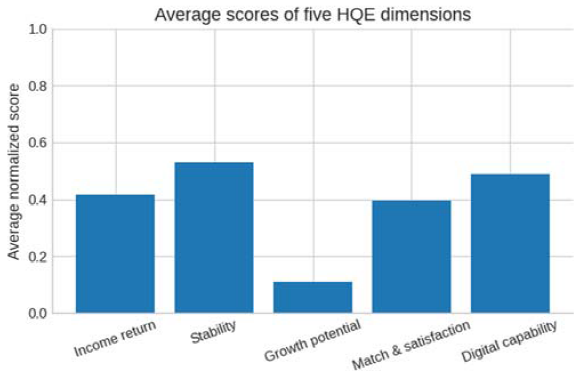
Figure 1. Standardized Mean Scores of Five HQE Dimensions for IT Graduates.
After training, the feature-importance scores for the five dimensions are normalized to construct the final HQE composite evaluation formula:

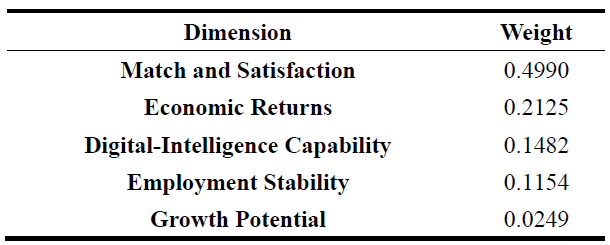
The resulting normalized weights for the five dimensions are presented in Table 3.
Table 3. HQE Dimension Weights (Normalized, Random Forest–Based).
To further elucidate the mechanism by which observed indicators contribute to the overall HQE score, this study calculates SHAP values based on a Random Forest model, building upon dimension-weight learning, to rank the global importance of key observed variables (see Figure 2) [26,27].The results reveal that variables such as “job matching score,” “career stability expectation,” “AI tool proficiency level,” and “programming capability” make prominent contributions to HQE prediction, with job-matching-related indicators demonstrating the most significant impact.
A Partial Dependence Plot (PDP, see Figure 3) was further constructed for the primary feature "job matching score," revealing a clear stepwise relationship with HQE level [28]. When the job matching score increases from the low range to the medium-high range, the predicted HQE level exhibits a significant leap, while the marginal improvement gradually diminishes within the high matching range. This finding indicates that the core driver of employment quality lies in job seekers' subjective perception of job fit, rather than salary level or stability alone.
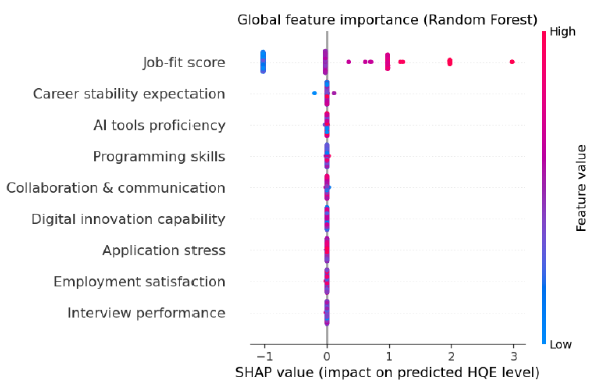
Figure 2. Global Feature Importance (SHAP Values) of Random Forest Model for Overall HQE Score.
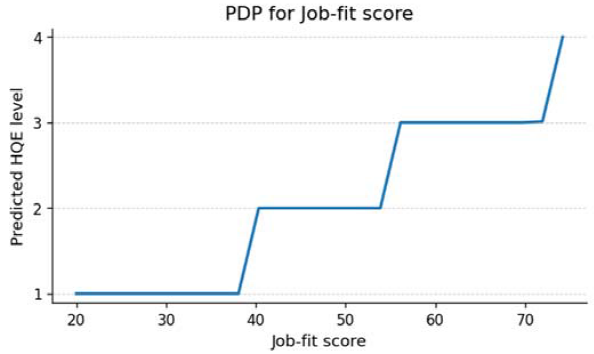
Figure 3. Partial Dependence Plot (PDP) of Job Matching Score on HQE Level.
5.3. Interpretation of the Weight Structure and Theoretical Implications
The weight allocation reveals the internal logic of HQE evaluation for IT graduates. Match and Satisfaction holds a dominant weight of nearly 50%, indicating that individuals’ subjective perceptions of fit with their current occupational context— including alignment between skills and job requirements and interest congruence with job content—form the core basis for judging employment quality. This finding aligns closely with person–environment (P–E) fit theory in vocational psychology, confirming the pivotal role of subjective experience in assessing modern knowledge work [20-23].
Economic Returns (21.25%) and Digital-Intelligence Capability (14.82%) respectively capture the observable external rewards and the intrinsic latent value of human capital, jointly underpinning objective assessment. The relatively lower weight of Employment Stability (11.54%) may reflect the high mobility of IT talent and the sector’s emphasis on skill upgrading and career development [6-8,18,19,25]. Growth Potential has the smallest weight (2.49%). While this may partly reflect the early-career stage of the sample, in which long-term development expectations may be less salient, this finding should be interpreted with caution. Specifically, the low weight may also reflect measurement limitations in the current operationalization of Growth Potential, which is represented by a single static indicator in the present framework.
6.1. Validity Verification and Distributional Characteristics
Validity test results.
To verify the predictive validity of the HQE composite scoring formula, this study computes the Pearson product–moment correlation between the composite score and the expert-rated criterion variable variable (employment-quality grade). The validity coefficient reaches 0.7094 (p < 0.001). According to Cohen’s (1988) benchmarks for effect sizes, this coefficient indicates a strong association between the composite score and the external evaluation standard, providing robust evidence that the proposed HQE evaluation system exhibits good criterion-related validity [29]. Figure 4 displays the distribution of overall HQE scores corresponding to each external employment quality level.
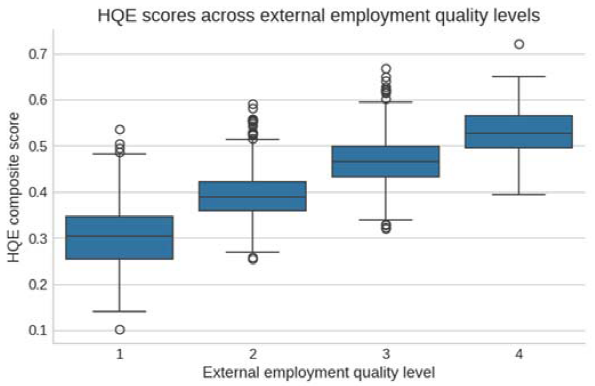
Figure 4. Distribution of Overall HQE Scores Corresponding to Different External Employment Quality Levels.
Descriptive statistics of distributional features.
The distribution of the HQE composite score is as follows: mean = 0.469, median = 0.468, standard deviation = 0.107, interquartile range (IQR) = 0.137 (Q1 = 0.405, Q3 = 0.542), and range = [0.156, 0.801]. In terms of shape, the mean and median are highly similar (difference of only 0.001), suggesting limited skewness in the HQE score distribution.
Substantive interpretation of statistical features.
These distributional properties reveal several points:
(1) Sufficient group heterogeneity: with a standard deviation of 0.107 relative to a mean of 0.469, the coefficient of variation is about 22.8%, indicating moderate differentiation in employment quality within the sample and good discriminative power and sensitivity of the composite score.
(2) Reasonable concentration: the interquartile range captures the central 50% of the sample distribution, and its width is moderate, avoiding insufficient precision due to overconcentration while also preventing excessive dispersion that could be driven by outliers.
(3) Effective value range: the substantial gap between the minimum (0.156) and maximum (0.801) suggests that the evaluation system effectively captures extreme cases of employment quality, with good coverage across the measurement range.
(4) Robust central tendency: the close alignment of the mean and median indicates a stable central tendency, providing a useful descriptive basis for subsequent analyses.
In sum, the HQE composite score demonstrates sound validity characteristics and favorable distributional properties at the statistical level, as summarized in Table 4, furnishing a solid psychometric foundation for subsequent applications and policy-oriented analyses. The kernel density distribution and box plot of the HQE composite scores are shown in Figure 5.
Table 4. HQE Distribution Statistics (N = 4,239).

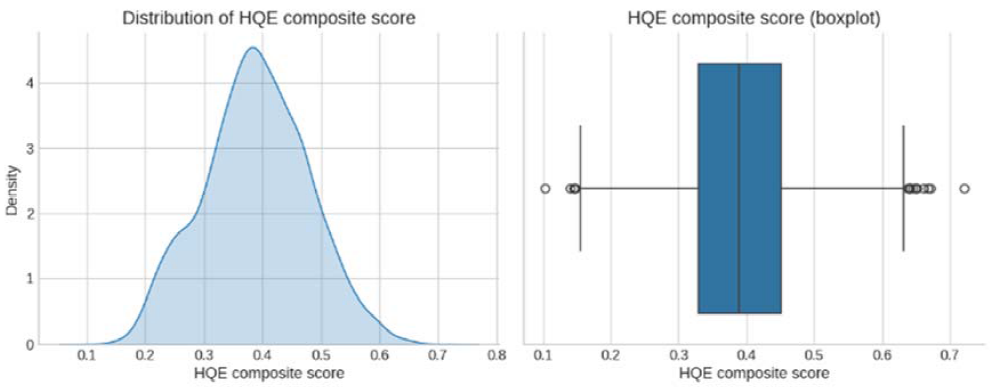
Figure 5. Kernel Density Distribution and Box Plot of Overall HQE Scores.
6.2. Comparative Analysis of Predictive Models and Key-Feature Identification
Model performance comparison.
To further evaluate the explanatory power of the HQE framework, we conducted a regression-based counterfactual analysis using multi-class job-search behaviors and background features while holding the HQE measurement spec constant. The nonlinear model (Random Forest) achieved a test-set (R^{2}) of approximately 0.705, outperforming the linear baseline (Ridge regression) at 0.635. This indicates that, in the presence of categorical variables and latent nonlinearity, Random Forest offers superior fit and interpretability, thereby supporting its use for dimension-weight learning and feature-importance analysis in this study.
Hierarchical analysis of key drivers.
Within the HQE composite framework, the core indicators for each dimension reflect the multi-level nature of employment-quality assessment in IT:
(1) Economic Returns: primarily income level and entry salary (direct pecuniary benefits). After business-threshold exclusion, both variables are min–max normalized to ([0,1]) for consistency across dimensions.
(2) Employment Stability: includes employment status (employed vs. not) and expected job stability. Binary/Likert items are same-direction coded and min–max normalized, facilitating subsequent rule-based mapping and normalization.
(3) Growth Potential: measured chiefly by the industry/position mapping score, capturing opportunity for advancement and sectoral outlook.
(4) Match and Satisfaction: integrates job–position fit, employment satisfaction, and a mismatch flag, foregrounding person–environment fit as the core mechanism in IT employment contexts.
(5) Digital-Intelligence Capability: centered on programming ability, digital-intelligence innovation capability, and skill proficiency, highlighting the IT sector’s specific skill requirements.
All dimensions undergo scale standardization and direction alignment; indicators are aggregated with equal weights and then normalized, ensuring comparability and statistical validity across dimensions. This standardized pipeline provides a reliable data foundation for weight estimation and composite scoring.
7.1. Core Findings and Theoretical Interpretation of the Weight Structure
The empirical results show that Match and Satisfaction dominates the HQE framework (weight = 0.4990), a finding with strong theoretical and empirical support. In the IT context, functional roles differ markedly in required competency structures, personal interest alignment, and work patterns. Individuals’ subjective perceptions of fit—comprising evaluations of task congruence, organizational culture identification, and career-path prospects—often constitute the decisive basis for judging employment quality. This accords closely with person–environment fit theory, confirming the centrality of subjective experience in evaluating employment quality within knowledge-intensive industries [20-23].
Economic Returns (weight = 0.2125) and Digital-Intelligence Capability (weight = 0.1482) support employment quality from two angles—“external, salient rewards” and “internal, latent capital.” Income returns, as the direct expression of labor-market value exchange, reflect the market pricing of individual human capital; digital-intelligence capability determines adaptability under rapid technological iteration and the potential for sustainable career development, embodying the IT sector’s specific skill demands [6-8,18,19,25].
7.2. Methodological Innovations and Appraisal of the Technical Pathway
Methodological contribution.
Methodologically, the core contribution lies in establishing a complete pathway of “theoretical construction—operational definition—model building—empirical testing,” rendering each component of the HQE framework traceable and interpretable. By using Random Forest feature importance for weight learning, the study reduces reliance on purely expert-based weighting and offers a data-driven solution for determining dimension weights [26].
Compared with ordinary least squares (OLS), which primarily captures linear relations, Random Forest is better suited to handle potential nonlinear effects and complex interactions across dimensions, providing a more precise tool for multidimensional composite evaluation [26].
Independence of validity verification.
The criterion variable—employment-quality grade (levels 1–5)—was generated through expert evaluation rather than through direct weighted aggregation of the five HQE dimensions. Specifically, seven experts independently rated respondents’ employment quality under a double-blind procedure on the basis of questionnaire information, and the mean rating was used to determine the final criterion value. Because this criterion was not mechanically constructed from the HQE composite formula itself, the Random Forest model did not predict a tautological target derived from the same weighted index. In this sense, the observed association between the HQE composite score and the expert-rated criterion provides meaningful criterion-related validation evidence.
The high correlation (r = 0.7094) between the HQE composite score and the criterion variable provides strong support for the validity of the proposed framework. Moreover, the high weight of Match and Satisfaction (0.4990) remains robust under this validation setting, suggesting that its importance is not merely an artifact of the weighting procedure but reflects a substantive relationship captured in the data.
7.3. Limitations and Directions for Improvement
Measurement limits of Growth Potential.
The relatively low weight of Growth Potential (0.0249) mainly stems from the current framework’s reliance on a static indicator—industry/position mapping score—without sufficiently incorporating diversified metrics of dynamic individual potential. Specifically, systematic measures are lacking for cumulative offer quality, anticipated career trajectories, and skill-learning capacity. This limitation chiefly reflects the cross-sectional nature of data collection, which constrains depiction of longitudinal development potential.
Data sources and sample representativeness.
Relying on cross-sectional survey data at a specific time point may entail sample-selection bias and temporal limitations. Future work should consider panel or follow-up designs to better capture the dynamics of employment quality and long-term trends.
7.4. Measurement Limitation of the Growth Potential Dimension
The relatively low weight of Growth Potential in the final HQE composite score (2.49%) should be interpreted with caution. This result does not necessarily indicate that career growth is intrinsically unimportant in the context of high-quality employment among IT graduates. Rather, it may partly reflect a measurement limitation in the current framework. In the present study, Growth Potential is operationalized through a single static indicator—industry_position_mapping_score—which captures only one structural aspect of future career advancement.
This operationalization does not fully reflect several important dimensions of growth potential, such as learning opportunities, promotion speed, skill accumulation pathways, role mobility, and subjective expectations regarding long-term development. In addition, the sample consists primarily of graduates at an early career stage, for whom immediate concerns such as income, stability, and person-job fit may be more salient than long-term growth prospects. Therefore, the observed low weight of Growth Potential should be understood as the combined result of sample characteristics and restricted measurement coverage, rather than as definitive evidence of the substantive unimportance of this dimension.
Future research should expand the measurement of Growth Potential by developing multi-item indicators that capture both structural and dynamic aspects of career development. Longitudinal tracking and career-stage comparison would also help determine whether the importance of Growth Potential increases as individuals accumulate work experience and face more differentiated advancement opportunities.
Addressing theoretical and methodological needs in evaluating employment quality among IT graduates, this study develops and validates an operational, verifiable High-Quality Employment (HQE) composite assessment framework. The core contributions are threefold:
Systematic construction of the theoretical framework.
We clarify a second-order hierarchical model of HQE, establish five core dimensions—Economic Returns, Employment Stability, Growth Potential, Match and Satisfaction, and Digital-Intelligence Capability—and align each with concrete survey variables for operational measurement. The framework inherits the essence of classic employment-quality theory while reflecting the professional and contemporary features of the IT sector.
Methodological innovation and technical breakthrough.
Under validation by an expert-rated criterion variable, we employ a nonlinear Random Forest approach for weight learning, reducing reliance on subjective weighting and establishing a data-driven HQE scoring model with stronger interpretive power [26].
Scientific assurance via empirical validation.
Through correlation with an expert-rated criterion variable (r = 0.7094), the HQE framework demonstrates predictive validity and discriminative capacity. Standardized data-processing procedures and reproducible computational steps further support its practical utility in empirical assessment [29].
Future directions.
Refinements may proceed along two axes:
Depth of measurement precision: enrich Growth Potential with objective, dynamic indicators—e.g., rank-promotion trajectories, changes in task complexity, and cross-department mobility—to capture multidimensional, long-horizon career growth.
Dynamic monitoring over time: build a longitudinal HQE system using panel data to study temporal evolution, shifting factor weights, and long-run predictive performance, thereby informing policy and individual career planning with greater precision.
With these enhancements, the HQE framework can evolve into an important tool for HR management and policy evaluation in the IT industry, supplying a scientific measurement foundation and empirical support for advancing the goal of high-quality employment.
Author Contributions: Conceptualization, Y.W.; methodology, Y.W.; data curation, R.W.; formal analysis, R.W.; investigation, R.W.; writing—review and editing, W.L.; validation, W.L.; project administration, Z.W.; resources, J.K.; writing—original draft preparation, J.K. All authors have read and agreed to the published version of the manuscript.
Funding: This research was supported by the following grants: 1. Research on the Employment Quality Prediction of IT Industry Graduates Based on a GRU Model in the Context of Digital Intelligence, Hubei Provincial Educational Science Planning Project, Grant No. 24Z278; 2. Construction and Practical Exploration of an Employability Evaluation System for University Graduates, Special Program of Philosophy and Social Sciences of the Hubei Provincial Department of Education, Grant No. 23Z621.
Conflicts of Interest: The authors declare no conflicts of interest. The funders had no role in the design of the study; in the collection, analyses, or interpretation of data; in the writing of the manuscript; or in the decision to publish the results.
Autor, D.H. Why Are There Still So Many Jobs? The History and Future of Workplace Automation. J. Econ. Perspect. 2015, 29, 3–30.
Frey, C.B.; Osborne, M.A. The Future of Employment: How Susceptible Are Jobs to Computerization? Technol. Forecast. Soc. Chang. 2013, 114, 254–280.
Chen, T. A Review of Research on College Students' Employment Quality. China Youth Soc. Sci. 2015, 3, 133–137 (in Chinese).
Shen, J. Research on the Evaluation Index System of Employment Quality in the New Era. Stat. Sci. Pract. 2020, 6, 13–16 (in Chinese).
Chen, C.; Zhou, J. On the Evaluation Index System of Employment Quality. Shandong Soc. Sci. 2014, 7, 37–43 (in Chinese).
Liu, Y.; Hua, Y.; He, Z. Research on Influencing Factors of Core Competencies of Higher Vocational Students in the Digital Intelligence Era. Peking Univ. Educ. Rev. 2024, 22, 170–186 (in Chinese).
Pan, J.; Li, C. Research on Improving College Students' Employment Ability in the Digital Intelligence Era. Sci. Educ. Wenhui 2024, 18, 33–36 (in Chinese).
Yang, Z. Digital Intelligence Employability: Capability Reshaping of Business Students in the Generative AI Era. 2025 (in Chinese). [Manuscript/Unpublished work]
Zhong, Y.; Luo, Z.; Tang, F. Construction of Measurement Index System for College Graduates' Employment Quality. Educ. Sci. Res. 2020, 9, 30–38 (in Chinese).
Sullivan, D.T.; Fries, K.S.; Relf, M.V. Exploring the Changing Landscape of Jobs for New Graduates: Practice, Education and New Graduate Imperatives. Creat. Nurs. 2012, 18, 186–190.
International Labour Office. Decent Work: Report of the Director-General; International Labour Conference, 87th Session; International Labour Office: Geneva, 1999.
Ghai, D. Decent Work: Concept and Indicators. Int. Labour Rev. 2003, 142, 113–145.
Anker, R.; Chernyshev, I.; Egger, P.; Mehran, F.; Ritter, J.A. Measuring Decent Work with Statistical Indicators. Int. Labour Rev. 2003, 142, 147–178.
Li, Q. Research and Application of Graduate Employment Prediction Model Based on Machine Learning. 2019 (in Chinese). [Manuscript/Unpublished work]
Li, Q.; Sun, Y.; Jiao, Y.; Gao, C.; Wang, M. Graduate Employment Prediction Method Based on HMIGW Feature Selection and XGBoost. Comput. Syst. Appl. 2019, 28, 203–208 (in Chinese).
Liu, Y.; Liu, R.; Yan, Z. Research on Employment Prediction of Mathematics Normal Students Based on Rough Set and Random Forest Algorithm. Hunan Norm. Univ. Nat. Sci. J. 2023, 46, 136–142 (in Chinese).
Wang, H.; Huang, Z.; Zhang, Y.; Wang, X. Research on Graduate Employment Quality Prediction Model. Changchun Norm. Univ. J. 2023, 42, 9–14 (in Chinese).
Han, Y.; Xu, H.; Zhao, C. Digitalization of Professional Competency Standards in Vocational Education: Competency Map and Application Scenario Development. 2024 (in Chinese). [Manuscript/Unpublished work]
Ni, C.; Zhai, S. Research on Countermeasures for Cultivating Digital Intelligence Technical and Skilled Talents. 2023 (in Chinese). [Manuscript/Unpublished work]
van Vianen, A.E.M. Person–Environment Fit: A Review of Its Basic Tenets. Annu. Rev. Organ. Psychol. Organ. Behav. 2018, 5, 75–101.
Kristof, A.L. Person-Organization Fit: An Integrative Review of Its Conceptualizations, Measurement, and Implications. Pers. Psychol. 1996, 49, 1–49.
Edwards, J.R. Person-Job Fit: A Conceptual Integration, Literature Review, and Methodological Critique. Int. Rev. Ind. Organ. Psychol. 1991, 6, 283–357.
Kristof-Brown, A.L.; Zimmerman, R.D.; Johnson, E.C. Consequences of Individuals' Fit at Work: A Meta-Analysis of Person–Job, Person–Organization, Person–Group, and Person–Supervisor Fit. Pers. Psychol. 2005, 58, 281–342.
Yan, Y. Research on Cultivation and Improvement of Digital Intelligence Capability of Rural Tourism Talents in Higher Vocational Colleges. 2025 (in Chinese). [Manuscript/Unpublished work]
Breiman, L. Random Forests. Mach. Learn. 2001, 45, 5–32.
Cohen, J. Statistical Power Analysis for the Behavioral Sciences, 2nd ed.; Lawrence Erlbaum Associates: Hillsdale, NJ, USA, 1988.
Lundberg, S.M.; Lee, S.-I. A Unified Approach to Interpreting Model Predictions. In Advances in Neural Information Processing Systems 30 (NeurIPS 2017); Curran Associates, Inc.: Red Hook, NY, USA, 2017; pp. 4765–4774.
Friedman, J.H. Greedy Function Approximation: A Gradient Boosting Machine. Ann. Stat. 2001, 29, 1189–1232.
Lauver, K.J.; Kristof-Brown, A.L. Distinguishing Between Employees' Perceptions of Person–Job and Person–Organization Fit. J. Vocat. Behav. 2001, 59, 454–470.