
The global energy system is undergoing a historic transition. With the escalating impacts of climate change and the rapid decline in the costs of solar and wind technologies, the vision of achieving 100% renewable grids is no longer idealistic but within reach. However, this energy transition presents significant challenges. Unlike conventional fossil fuels, solar and wind energy resources are weather-dependent and thus inherently variable and uncertain, raising concerns over energy security, particularly under extreme weather conditions. Existing system design and modelling approaches often address these challenges in isolation and are limited in their ability to evaluate long-term renewable transitions at high temporal and spatial resolutions. To overcome these limitations, this study proposes the FIRM strategy, an integrated framework comprising Flexible renewable generation (F), Interconnection of electricity grids (I), Response from demand-side participation (R), and Mass electricity storage (M). Together, the four pillars help unlock system-wide flexibility, facilitating large-scale renewable energy integration while maintaining grid stability and resilience. To incorporate the FIRM strategy into energy planning, a new two-step energy balance modelling approach is developed, combining heuristic infrastructure optimisation with high-resolution chronological simulation. This modelling approach enables efficient simulation of large-scale, interconnected electricity grids with high penetration of solar and wind power. Applied to Australia and the Asia-Pacific, the modelling demonstrates that the integrated FIRM strategy can help effectively reduce electricity costs while stabilising 100% renewable grids. By embedding flexibility across electricity generation, transmission, storage, and utilisation, this strategy offers an integrated system design and modelling framework to inform policy and support the development of stable, resilient, and fully decarbonised electricity grids.
In response to the escalating impacts of climate change, countries around the world are accelerating the transition from fossil fuel-based systems towards renewable energy futures. This remarkable transition is underpinned by ongoing technology advances and rapid cost declines in renewable energy technologies, with solar and wind power emerging as key components of modern electricity grids. In 2024 alone, global solar and wind capacity increased by 452 GW and 113 GW, respectively — together 7.4 times the 76 GW increase in fossil fuel-based electricity generation capacity [1]. In many regions of the world, solar and wind power have become the lowest-cost sources of new electricity generation, undercutting all other generation technologies in electricity markets. In Australia, for example, the Commonwealth Scientific and Industrial Research Organisation (CSIRO) [2] estimated the levelised costs of electricity (LCOE) for solar and onshore wind at A$47–79/MWh (US$31–52/MWh) and A$66–109/MWh (US$43–71/MWh) in 2023-24. In comparison, new coal- and gas-fired power had significantly higher costs, estimated at A$107–211/MWh (US$70–138/MWh) and A$124–183/MWh (US$81–120/MWh), respectively.
Despite rapid progress, the shift to high-renewable grids presents significant operational challenges. Solar and wind power are inherently variable and uncertain, with weather-driven intermittency occurring across various timescales. Additionally, their inverter-based grid interfaces lack the inertia provided by conventional synchronous generators, increasing the risk of grid instability. As the share of renewable energy increases, electricity grids face evolving technical challenges, including capacity inadequacy, lower minimum generation levels, higher ramping rates, and more frequent cycling of thermal generators [3]. These challenges are further intensified by the increasing frequency and intensity of extreme weather events driven by climate change. Recent events including major blackouts during California's 2020 heatwave [4], Texas' 2021 cold snap in the U.S. [5], and Victoria's 2024 thunderstorm in Australia [6] highlight the need for stronger grid stability and resilience amid increasingly extreme weather conditions.
An emerging body of literature highlights the critical role of system flexibility within high-renewable grids in ensuring energy security. For example, Hunter et al. [7] conducted a techno-economic analysis of 14 long-duration energy storage (e.g., pumped hydro, batteries, hydrogen) and flexible power generation (e.g., natural gas and ethanol with carbon capture) technologies, comparing their levelised costs across various discharge durations for an 85% renewable grid in the western United States. Tong et al. [8] analysed the capability of solar and wind power to meet electricity demand across 42 countries, quantifying the reliability of high-renewable grids under scenarios with different combinations of renewable energy mixes, renewable generation levels, and energy storage capacities. Guo et al. [9] applied a global integrated assessment model to evaluate the impacts of renewable electricity trade across eight world regions, showing that an intercontinental super-grid could increase renewable electricity generation by up to 12% by 2050 and reduce cumulative CO2 emissions by up to 10% between 2020 and 2100. While existing studies offer valuable insights into system flexibility in high-renewable grids, much of the research remains narrow in scope, focusing on individual technologies, specific regions, or relying on simplified, time-averaged modelling approaches. Additionally, conventional optimisation-based models face computational constraints in simulating long-term renewable transitions at high resolution across large-scale, interconnected electricity grids. Addressing these limitations requires an integrated system design framework coupled with a modelling approach capable of capturing operational dynamics across both spatial and temporal scales.
This article proposes the FIRM strategy, an integrated system design framework built on four key pillars of flexibility:
• Flexible renewable generation, e.g., hydropower, geothermal, and biomass;
• Interconnection between electricity grids to facilitate geographic smoothing and regional balancing;
• Response from demand-side participation, e.g., flexible electric vehicle charging, hot water storage, and industrial hydrogen storage;
• Mass electricity storage, including batteries, pumped hydro, and other storage technologies.
Together, these pillars help unlock the system-wide flexibility required to ensure energy security within electricity grids dominated by solar and wind power. Thus, the FIRM strategy offers an integrated system design framework for energy infrastructure planning across diverse temporal and spatial dimensions.
Furthermore, this article presents a new two-step energy balance modelling approach to optimise system configurations aligned with the FIRM strategy. The first step uses heuristic optimisation to identify least-cost portfolios of electricity generation, storage, and transmission infrastructure. The second step conducts a high-resolution, rolling-window chronological analysis to assess energy adequacy under various weather conditions. This modelling approach captures operational dynamics while maintaining computational tractability, enabling high-resolution simulation of long-term renewable transitions across large-scale, interconnected electricity grids. The modelling approach has been applied to two distinct regional contexts, Australia and the Asia-Pacific, differing in resource availability, grid structures, and decarbonisation trajectories. By exploring national, regional, and decentralised configurations, the modelling offers strategic insights applicable to various meteorological, geographic, and infrastructural settings.This article is structured as follows: Section 2 reviews global trends in renewable energy deployment and electrification in the context of net-zero transitions; Section 3 outlines the operational challenges of integrating high shares of solar and wind power into electricity grids; Section 4 introduces the FIRM strategy as an integrated system design framework for enabling system-wide flexibility; Section 5 presents the two-step modelling framework and its application to Australia and the Asia-Pacific region; Section 6 concludes with key findings and policy implications for stabilising 100% renewable grids.
2.1. Accelerating Global Renewable Energy Deployment
The global deployment of renewable energy has been growing rapidly. According to the International Renewable Energy Agency (IRENA) [1], the net growth in renewable generation capacity has surpassed that of fossil fuels since the early 21st century. Between 2000 and 2024, renewable generation capacity (including solar, wind, hydro, biomass, geothermal, and marine energy) increased from 759 GW to 4448 GW, with a net increase of 3689 GW. Solar and wind power have led this growth, together comprising 81% (2980 GW) of the increase in renewable generation capacity. In contrast, fossil fuel-based generation capacity (coal, oil, and natural gas) increased from 2290 GW to 4548 GW, adding 2258 GW over the same period. At its current growth rate, global renewable generation capacity is set to overtake that of fossil fuels in 2025, marking a major milestone in the transition toward 100% renewable electricity.
Figure 1 shows the share of combined solar and wind generation capacity as a proportion of total electricity generation capacity across the world's major economies. At the end of 2024, solar and wind power accounted for about 31% (2998 GW) of the global total generation capacity of 9590 GW. Among the G20 economies, Germany led with 59% of its generation capacity from solar and wind power, followed by Australia, the United Kingdom and the European Union, each sourcing 46% of their generation capacity from solar and wind. The world's three largest greenhouse gas (GHG) emitters, China, the United States, and India (which collectively contributed nearly half of global emissions in 2023 [10]), ranked fifth (42%), twelfth (26%), and eleventh (27%), respectively.
The widespread deployment of solar and wind power, coupled with advancements in technology, has driven substantial reductions in renewable energy costs. According to IRENA [11], the global weighted average of the LCOE for utility-scale solar dropped to US$44/MWh in 2023, representing a 90% decrease from US$460/MWh in 2010. The global average LCOE for wind power dropped to US$33/MWh (onshore) and US$75/MWh (offshore) in 2023, representing reductions of 70% and 63% compared to their 2010 costs of US$111/MWh and US$203/MWh, respectively. Due to the low short-run marginal cost, the increasing share of renewable energy has led to more frequent occurrences of zero or even negative prices in electricity spot markets, including Australia's National Electricity Market.
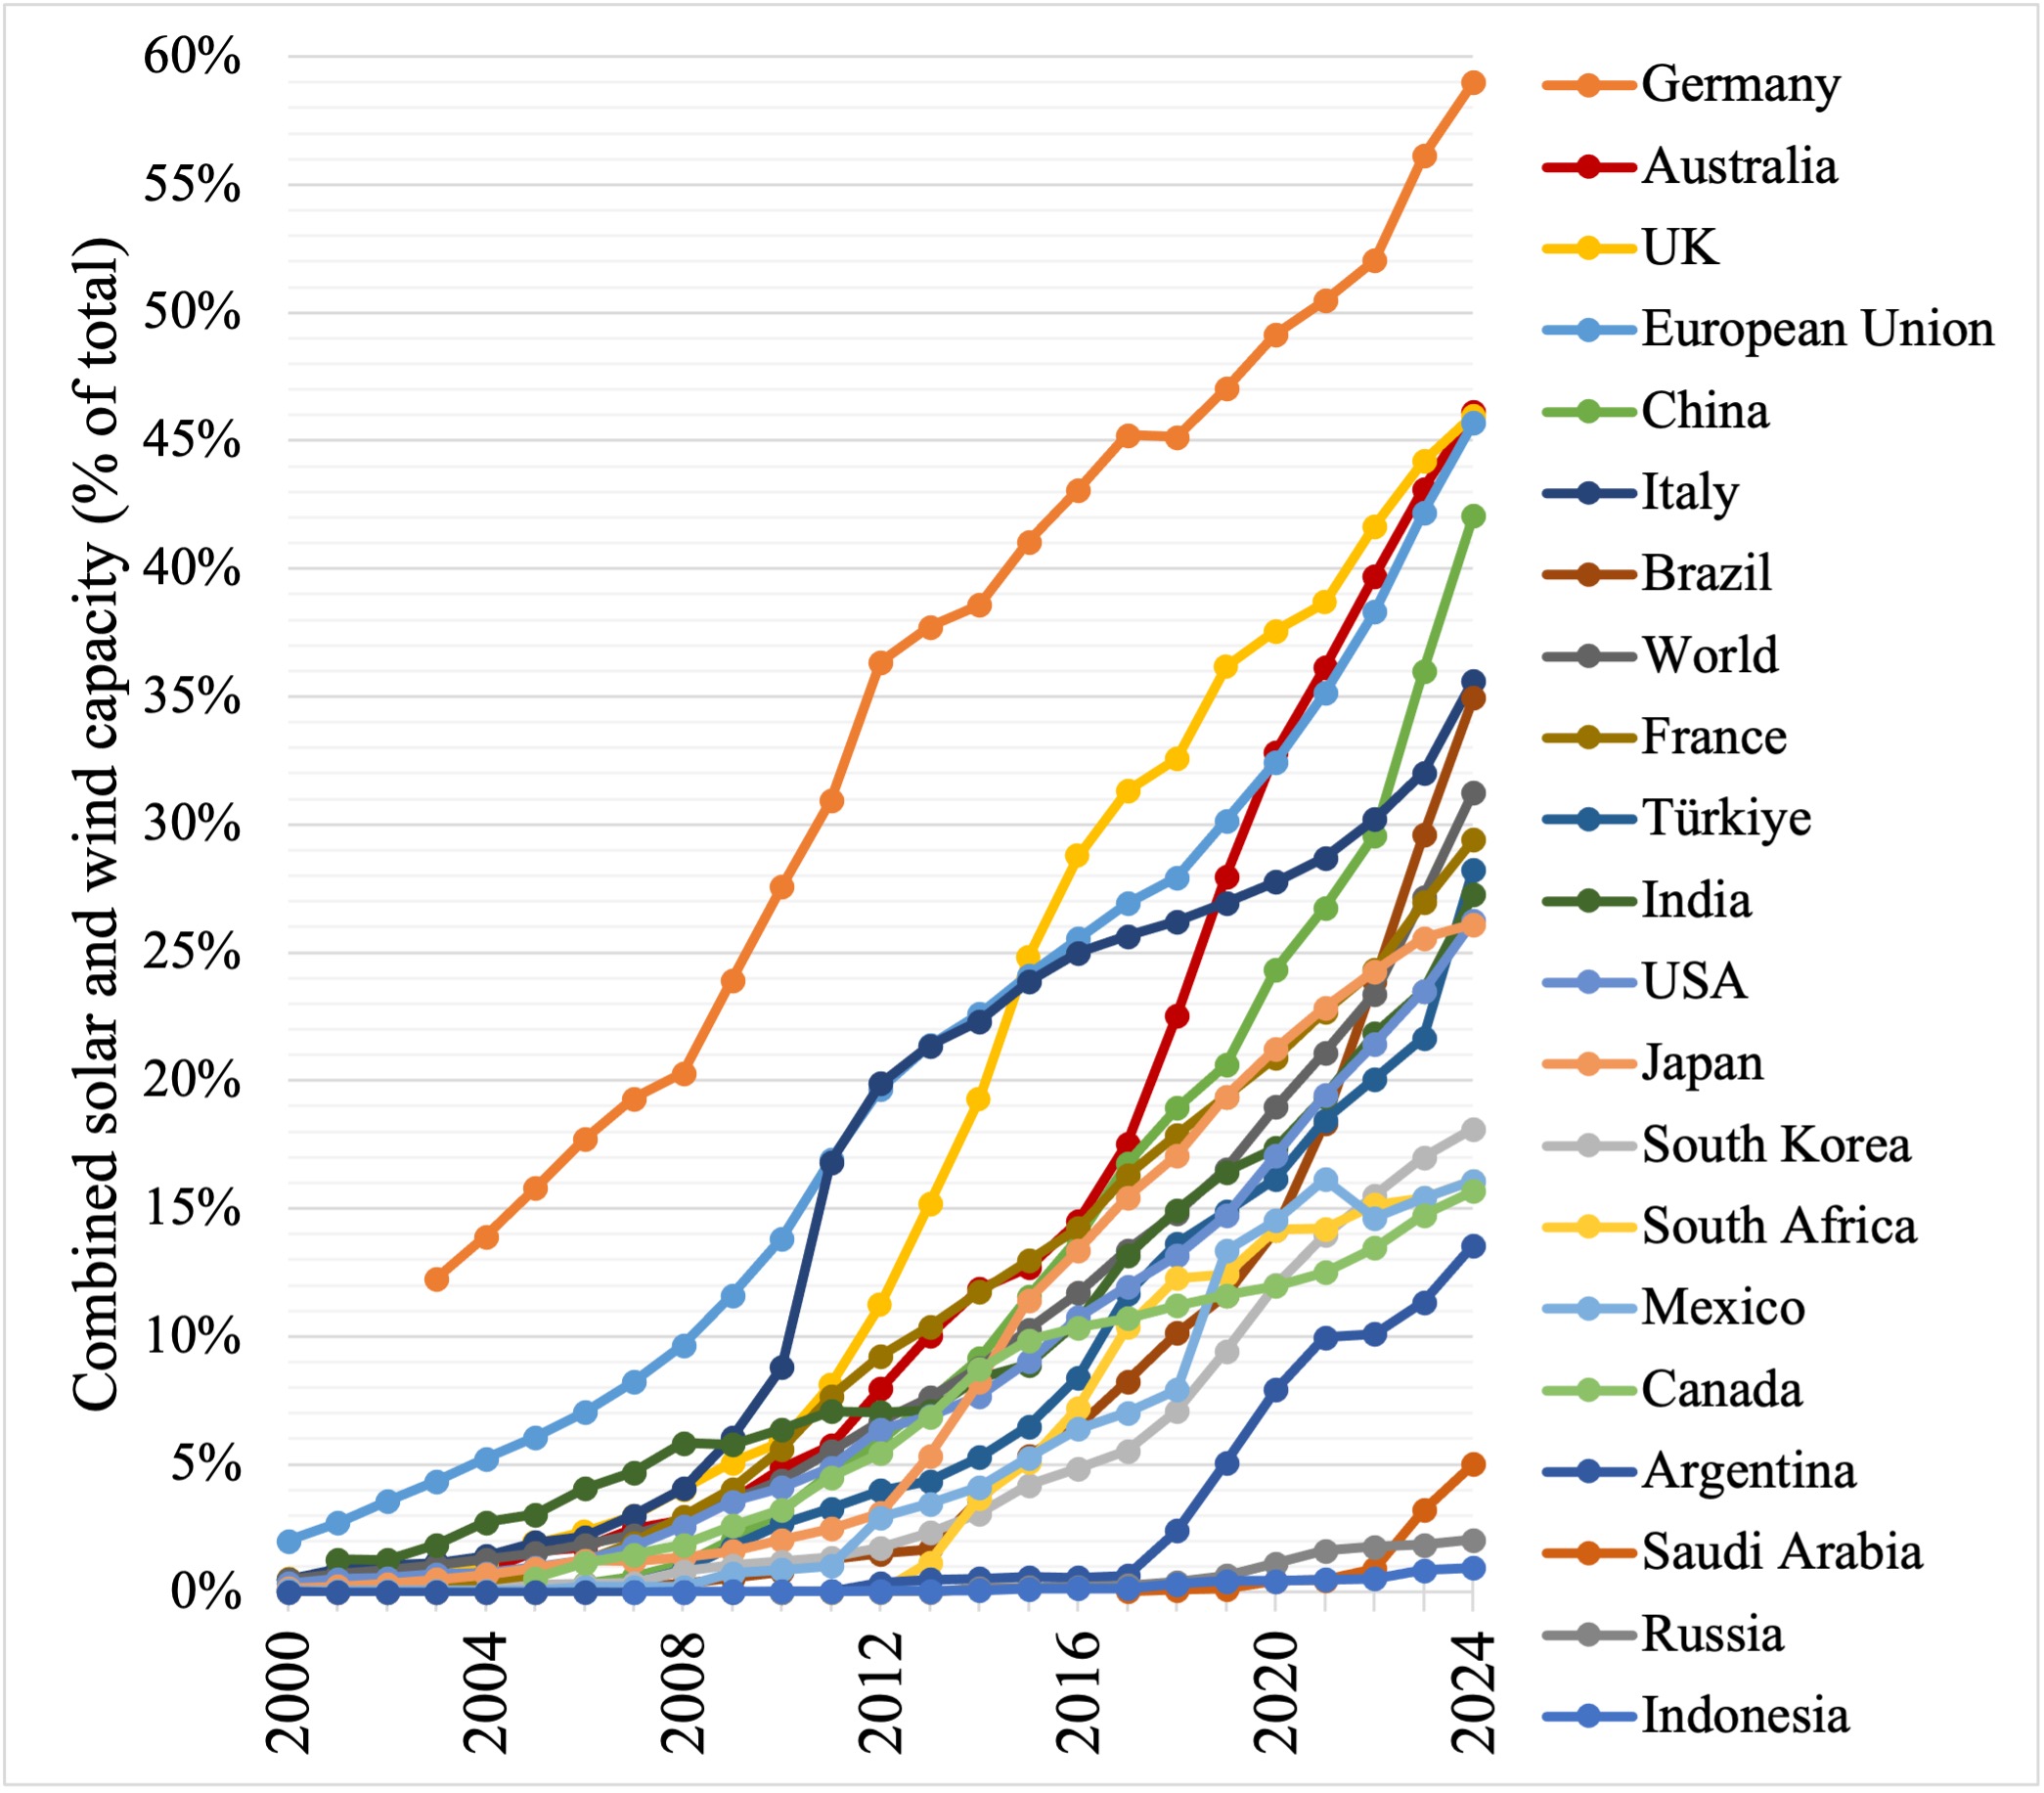
Figure 1. Growth in the share of combined solar and wind capacity in total electricity generation capacity across G20 economies over time. Data source: IRENA [1].
2.2. Pathway to Net Zero: Renewable Energy Plus Electrification
Despite rapid growth of renewable energy in electricity generation, its share across the broader economy remains low. According to the International Energy Agency (IEA) [12], the global energy supply reached 622 EJ in 2022, with coal, oil, and natural gas accounting for 172 EJ (28%), 188 EJ (30%), and 144 EJ (23%), respectively. In comparison, renewable energy only contributed 89 EJ, about 14% of the total. Thus, achieving economy-wide decarbonisation requires replacing fossil fuels with renewables in the electricity sector, along with electrifying other sectors, including transport, buildings, and industry, through direct or indirect means. Figure 2 illustrates global GHG emissions by sector, with energy-related emissions accounting for over three-quarters of total GHG emissions in 2021 [13]. The main sources of energy-related emissions included electricity and heat, transportation, manufacturing and construction, buildings, and fugitive emissions from the extraction, refining, and distribution of fossil fuels. To achieve net-zero emissions across these energy sectors, four key decarbonisation pathways can be implemented:
• Pathway 1: Renewable electricity generation. Transitioning from fossil fuels to renewables in the electricity sector is fundamental, as it directly eliminates emissions from electricity generation and provides clean energy source for other sectors.
• Pathway 2: Direct electrification. For residential and commercial buildings, the use of fossil fuels can be replaced with electric appliances for water heating, air heating and cooking. For industrial heating, fossil fuels can be replaced with electric heating technologies, e.g., industrial heat pumps, electric furnaces. For manufacturing and construction, internal combustion engines can be replaced with electric machines. For transport, internal combustion engine vehicles can be replaced with electric vehicles.
• Pathway 3: Indirect electrification. For sectors where direct electrification is difficult, e.g., air transport, water transport, long-distance road and rail transport, hydrogen and electro-fuels can be carbon-free or carbon-neutral alternatives to fossil fuels. Green hydrogen is produced via water electrolysis using renewable electricity. Carbon for fuel synthesis can be sourced from biomass or carbon capture technologies, e.g., direct air capture powered by renewable electricity.
• Pathway 4: Elimination of fugitive emissions. Fugitive emissions, e.g., methane leakage and gas flaring, will eventually be eliminated as fossil fuel extraction, refining, and distribution are phased out of the global energy supply.
Beyond energy-related emissions, renewable energy plus electrification can also contribute to decarbonising certain non-energy sectors. For example, in green steelmaking, the conventional blast furnace-basic oxygen furnace route can be replaced with hydrogen-based direct reduction followed by electric arc furnace processing, where the use of coking coal is replaced by using green hydrogen. For green ammonia production, green hydrogen can be a carbon-free feedstock for the Haber-Bosch process, replacing fossil fuel-derived hydrogen in ammonia synthesis.
Importantly, decarbonisation through renewable energy plus electrification offers multiple advantages. A key benefit is the significantly improved energy efficiency, as electric technologies generally have higher energy conversion efficiencies than their fossil fuel counterparts. Jacobson et al. [14] demonstrated that in a 100% wind-water-solar scenario by 2050, global energy consumption could reduce by 56% compared to a business-as-usual scenario, primarily due to the high efficiency of electrified energy systems. Electrification also plays a vital role in reducing air pollution and associated health risks. Lelieveld et al. [15] estimated that air pollution from fossil fuel combustion caused 5.13 million (3.63–6.32 million range) premature deaths worldwide annually. In contrast, solar and wind energy produce no harmful air pollutants during electricity generation, effectively mitigating air pollution and its health impacts.Renewable energy plus electrification can strengthen energy security by reducing reliance on depleting fossil fuel resources. At the end of 2020, the proven oil and gas reserves were estimated at 244 Gt and 188 trillion m3, respectively [16]. At their 2023 global consumption rates of 196 EJ for oil, and 144 EJ for natural gas, these reserves could be depleted within 50 years or sooner, as energy demand is rising due to economic development, population growth, and urbanisation. According to IEA's World Energy Outlook [17], global energy demand was projected to increase by 30% by 2050 under its Stated Policies Scenario, with two-thirds of the growth occurring in the Asia-Pacific. Additionally, the geographical concentration of fossil fuel reserves raises concerns over energy security. Most proven oil reserves are concentrated in several countries, including Venezuela (18%), Saudi Arabia (17%), Canada (10%), Iran (9%), Iraq (8%), Russia (6%), Kuwait (6%), and the United Arab Emirates (6%) [16]. This concentration increases the risk of energy supply disruptions due to geopolitical instability, trade restrictions, and price volatility. In comparison, renewable energy resources are widely distributed across the globe. About 99.97% of renewable energy [18] comes from the Sun (solar, wind, hydro, and biomass), while the remaining 0.03% from the mantle (geothermal) and the gravitational attraction to other celestial bodies (tidal). These energy resources are naturally replenished and less vulnerable to geopolitical risks or supply chain disruptions.
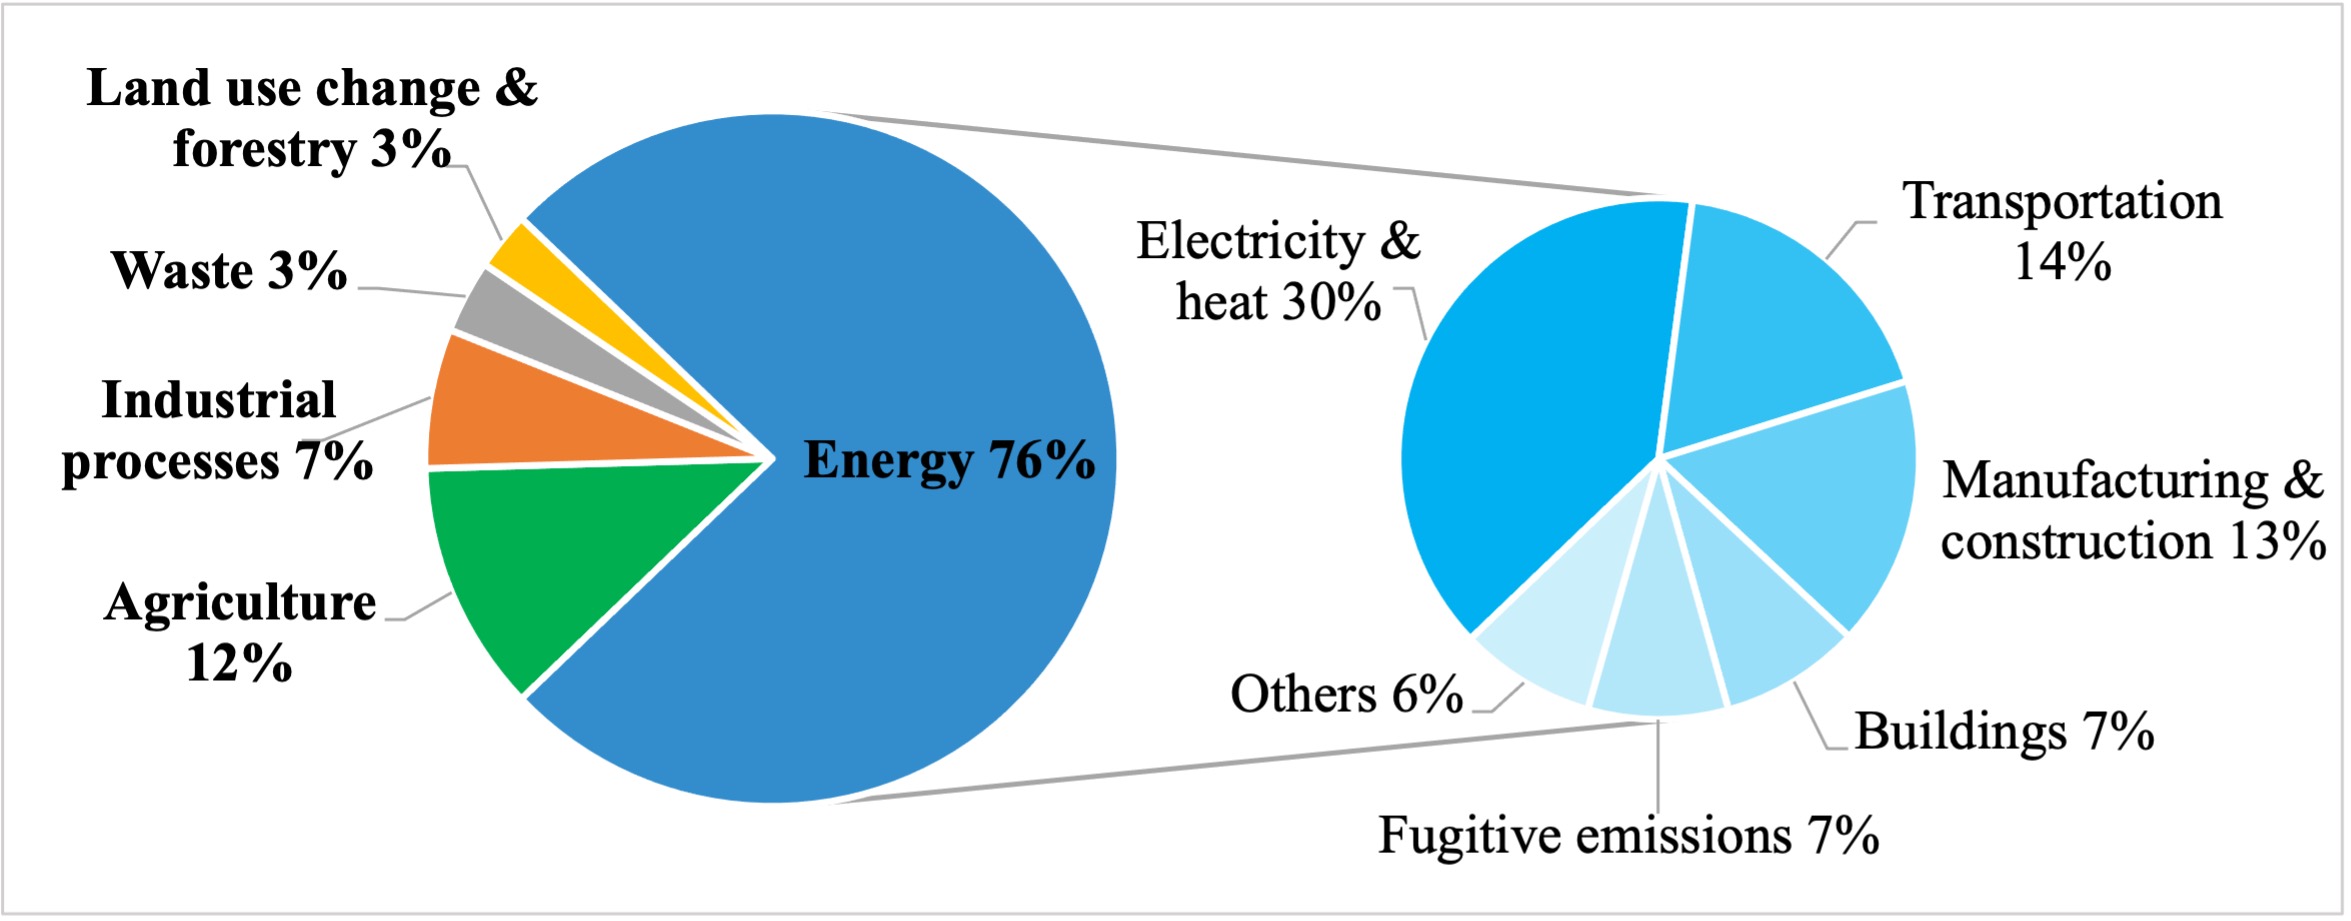
Figure 2. Global GHG emissions by sector and energy subsector (%), based on total GHG emissions of 49.6 Gt CO₂-e in 2021. Data source: World Resources Institute [13].
2.3. Net-zero Emissions Commitments
As of April 2025, 142 countries had announced net-zero emissions targets, covering 76% of global emissions and 84% of global population, including the European Union (2050), China (2060) and India (2070) [19]. The United States, while not officially committed to net-zero emissions, aimed to reduce emissions by 61%–66% below 2005 levels by 2035 in its 2024 Nationally Determined Contribution [20]. However, the Trump administration's 2025 decision to withdraw from the Paris Agreement for a second time has led to significant uncertainty regarding the long-term trajectory of U.S. climate policy. Despite such setbacks, the global momentum for renewable energy development remains strong. According to IEA's Net Zero by 2050 [21], achieving net-zero emissions would require adding 1000 GW of solar and wind power each year, nearly twice the renewable capacity added in 2024. As the world accelerates towards net-zero emissions, the rapid deployment of renewable energy remains central to global decarbonisation efforts.
3.1. Characteristics of Solar and Wind Power
Unlike fossil fuel-based electricity generation, solar and wind power have a range of distinct characteristics, e.g., variability, uncertainty, and inverter-based grid interface. Coal- and gas-fired power can provide continuous output and support grid stability by offering synchronous inertia, albeit with different levels of dispatchability. Empirical data from electricity markets [2] suggested that these generating units can achieve capacity factors up to 90%, with the remaining 10% accounting for scheduled or unscheduled outages. The capacity factor is the ratio of actual electricity generation over a year to the theoretical maximum generation if the unit can operate at its rated capacity at all times. In comparison, solar and wind power are variable and uncertain in nature. The output of solar photovoltaics is primarily determined by global horizontal irradiance levels, while wind power mainly depends on wind speeds at turbine hub heights. Other meteorological conditions, e.g., temperature, humidity, air pressure, precipitation, and snow cover, also affect their power outputs. The Global Solar Atlas [22] shows that even in the world's sunniest regions, e.g., northern Africa, western Australia, and the western coast of South America, the capacity factors of solar power remain below 30%. Similarly, the average capacity factor of the 150 GW installed wind power in the United States was only 34% in 2023 [23].
Notably, the intermittency of solar and wind power occurs across multiple timescales. Figure 3 illustrates the power outputs of the 324 MW Darlington Point Solar Farm and the 452 MW Coopers Gap Wind Farm as proportions of their rated power capacities. They both showed significant fluctuations across minutes to months, highlighting the need for an integrated strategy to manage variability across multiple timescales.
The variations in renewable power output also vary geographically, due to differences in regional climate patterns. According to data from the Global Solar Atlas [22], the seasonal variability of solar power output varies significantly across the globe. Here, the seasonality is measured as the ratio of electricity generation during the three highest-output months to that of the three lowest-output months. In Berlin (northern Europe), the ratio exceeds 5, while in New York City and Los Angeles (northern and southern United States), the ratios are 1.5 and 1.3, respectively. In equatorial regions like Singapore, the seasonal variation is minimal, with a seasonality ratio of only 1.2.
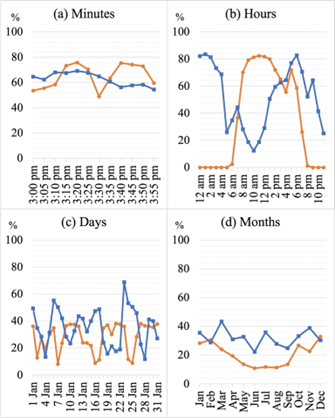
Figure 3. Power outputs as a proportion of rated capacity from the Darlington Point Solar Farm (orange) and the Coopers Gap Wind Farm (blue) at four timescales: (a) 1 January 2024, 3:00–3:55 pm; (b) 1 January 2024, 12 am–11 pm; (c) 1–31 January 2024; and (d) January–December 2024. Data source: NationalMap [24].
Renewable power output is inherently uncertain due to imperfect weather forecasting. Forecasting errors for solar and wind power outputs increase significantly as the forecasting window increases over longer time horizons. Hodge & Milligan's analysis [25] of 10 wind farms in the Electric Reliability Council of Texas indicated that the root mean squared forecasting errors rose from under 5% at a 5-minute timescale to up to around 20% at a 200-minute timescale. Nevertheless, recent advances in machine learning have substantially improved the accuracy of weather and renewable energy forecasts. Price et al. [26] demonstrated that a machine learning-based forecasting model, GenCast, outperformed traditional numerical weather prediction models, e.g., ECMWF-ENS. By comparing the forecasting data from 5344 wind farms worldwide, GenCast reduced the continuous ranked probability score errors by about 20% for forecasts up to 2 days ahead and by 10%–20% for forecasts 2–4 days ahead.
A critical feature of solar and wind power is their integration into the grid via inverter-based interfaces. Coal- and gas-fired power use synchronous generators, with rotors spinning in synchrony with the grid frequency, 50 or 60 Hz. For instance, a synchronous generator with an inertia constant of 5 seconds and a rated capacity of 200 MW contributes 1000 MW·s of synchronous inertia to the grid. Inertial energy plays a critical role in maintaining grid stability over very-short timescales (e.g., milliseconds to seconds), helping absorb disturbances from load fluctuations, transmission faults, and generator outages. However, inverter-based solar and wind generators do not provide such rotational inertia, presenting challenges for grid stability. For example, South Australia has one of the highest shares of solar and wind power globally and is weakly connected with other Australian grids. In 2023, solar and wind power generated 10,575 GWh of electricity, accounting for 77% of its total electricity generation of 13,761 GWh [27]. As renewable energy share continues to increase, the availability of synchronous inertia in South Australia was projected to decrease from 6200 MW·s in 2023-24 to 4400 MW·s by 2030 [28]. Since the rate of change of frequency [29] is inversely proportional to system inertia, reduced inertia levels can result in faster frequency deviations, thus increasing the risk of grid instability and separation.
3.2. Technical Challenges of Large-scale Renewable Energy Integration
Due to their distinct characteristics described in Section 3.1, large-scale integration of renewables poses a variety of operational challenges for grid stability. These challenges include capacity inadequacy, lower minimum generation levels, higher ramping rates, and more frequent cycling of thermal generators. Figure 4 illustrates South Australia's generation mix between 7 and 14 March 2025 with a 5-minute temporal resolution.
• Capacity inadequacy. As shown in Figure 4a, on 9 March at 7:00 pm, electricity demand reached 2653 MW, while solar and wind power output was only 136 MW (solar 65 MW, wind 71 MW), resulting in a capacity shortfall of 2517 MW. This shortfall was met by natural gas-fired power in South Australia and electricity imports from the neighbouring state, Victoria.
• Lower minimum generation levels. Figure 4b highlights the issue of low minimum generation levels. On 13 March at 12:00 pm, solar and wind power output reached 2234 MW (solar 2020 MW, wind 214 MW), exceeding the electricity demand of 2128 MW. During this period, thermal generators operated near their technical minimum, increasing the risks to generator stability and safety.
• Higher ramping rates. Figure 4c highlights ramping challenges. On 8 March, solar power output declined from 1338 MW at 3:00 pm to zero by 8:00 pm, when the evening peak increased to the 2176–2715 MW range. During this period, wind power output fluctuated between 478 MW and 1378 MW. To support the evening peak, natural gas-fired generators ramped up sharply from 259 MW to 1022 MW, approaching their maximum ramping capability.
• More frequent cycling of thermal generators. Figure 4d show frequent startups, shutdowns, and ramping cycles of natural gas-fired generators for balancing intermittent renewables. This increased cycling contributed to reduced operational efficiency and higher operating costs. The 2016 closure of South Australia's last coal-fired power, the Northern Power Station, highlighted the economic challenges faced by thermal generators in high-renewable electricity markets. Australia has set an 82% renewable energy target in its National Electricity Market by 2030, increasing from 39% in 2023. Accordingly, South Australia's renewable energy share is expected to continue rising, potentially reaching 100% renewables or even higher through electricity and green hydrogen exports. As natural gas-fired power is gradually phased out of the electricity market, managing high renewable energy penetration will become increasingly complex, requiring integrated flexibility strategies.
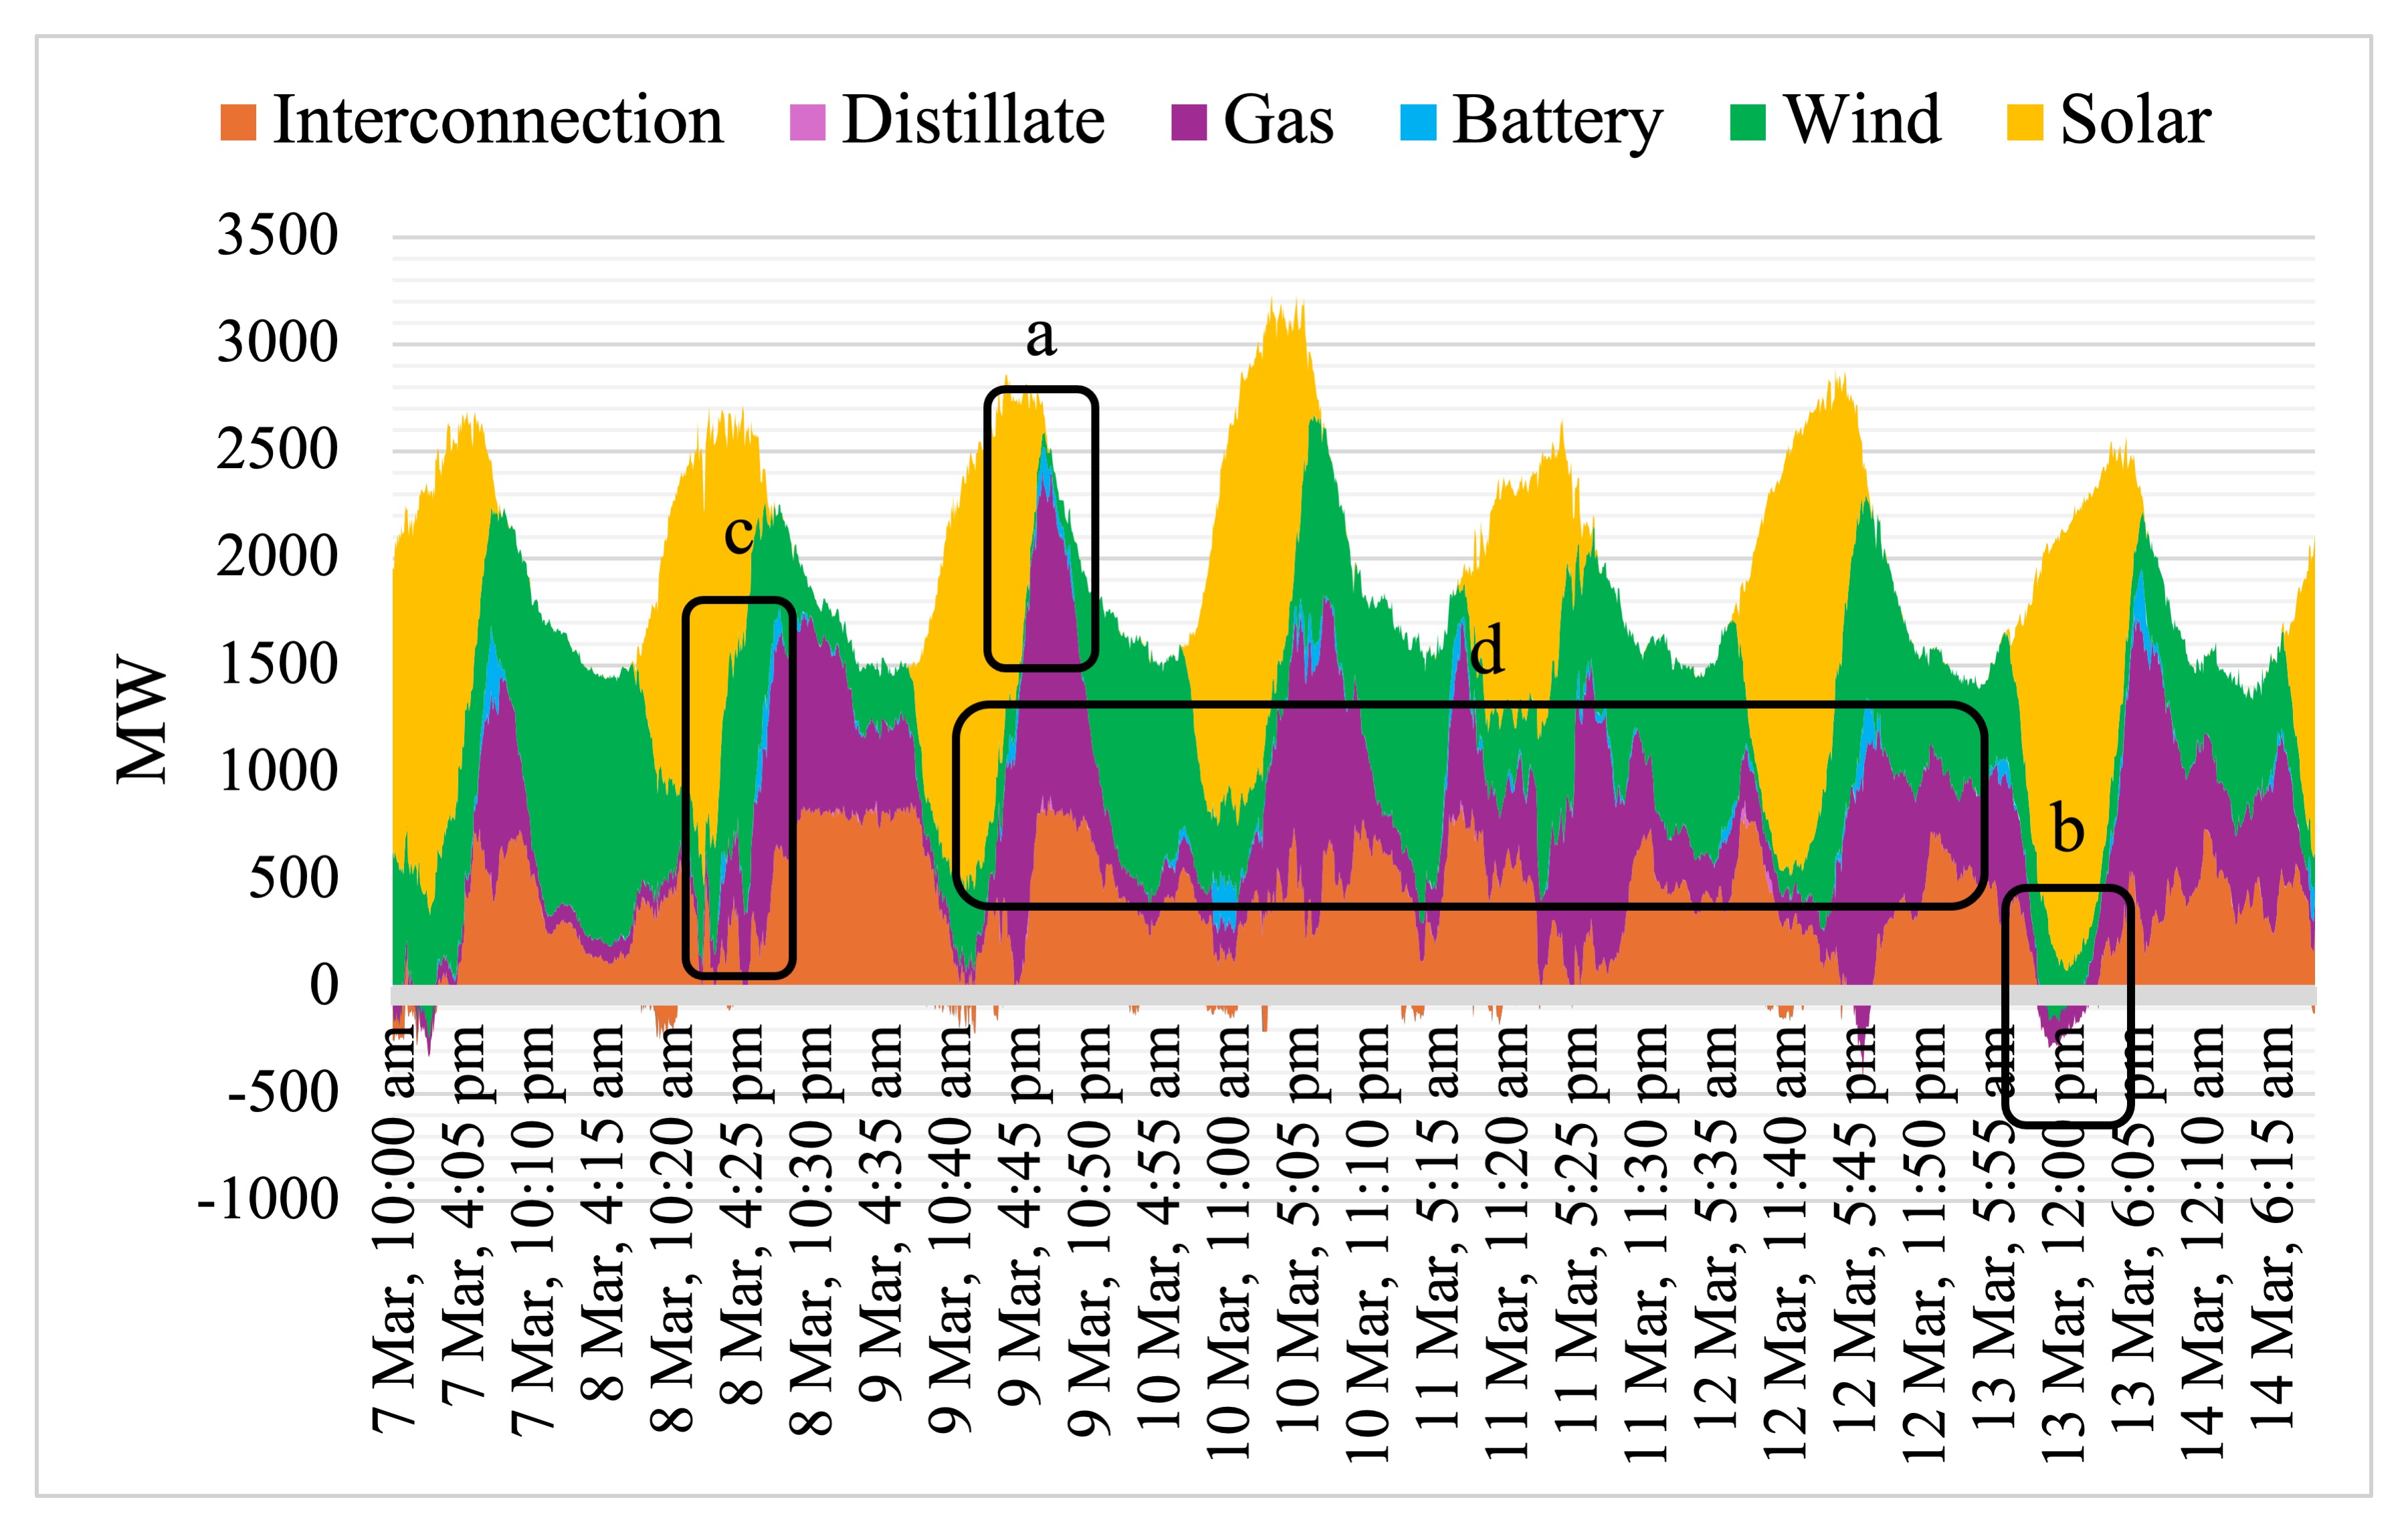
Figure 4. South Australia's generation mix between 7 and 14 March 2025, showing key challenges of high renewable energy penetration: (a) capacity inadequacy, (b) lower minimum generation levels, (c) higher ramping rates, (d) more frequent cycling of thermal generators. Data source: Open Electricity [30].
3.3. Impact of Extreme Weather Events on Energy Security
Climate change is driving increases in the frequency and intensity of extreme weather events [31], e.g., heatwaves, cold snaps, and storms. As a result, energy security is increasingly challenged by these extreme weather conditions. Recent major blackout events around the world highlight the significant impact of extreme weather conditions on energy security. As renewable energy share grows, ensuring the resilience of high-renewable grids under these conditions becomes increasingly critical.
Additionally, extreme weather can also negatively impact renewable energy outputs. Wind turbines have specific cut-out wind speeds to avoid structural damage, e.g., 22.5 m/s for Vestas' V150-4.2 MW [32]. Solar photovoltaic efficiency declines with high temperatures, typically by 0.5% per degree Celsius rise in ambient temperature [33]. To maintain long-term energy security in a changing climate, high-renewable grids must be built with robust resilience to withstand extreme weather impacts.
As discussed in Section 3, the large-scale integration of renewable energy presents complex challenges for grid stability and resilience. Addressing these challenges requires an integrated strategy to ensure secure operation of electricity grids. The FIRM strategy offers a comprehensive framework for stabilising high-renewable grids, built on four pillars: (i) Flexible renewable generation; (ii) Interconnection between electricity grids; (iii) Response from demand-side participation; and (iv) Mass electricity storage.
The synergy of these pillars unlocks system-wide flexibility across all stages of the electricity supply chain, as shown in Figure 5. This flexibility is critical for managing the inherent variability and uncertainty of renewable energy resources. Flexibility, as defined by the U.S. National Renewable Energy Laboratory, refers to "the ability of a power system to respond to change in demand and supply" [34]. By implementing the FIRM strategy, electricity infrastructure configurations can be strategically optimised to support rapid uptake of renewable energy, while ensuring high levels of grid stability and resilience.
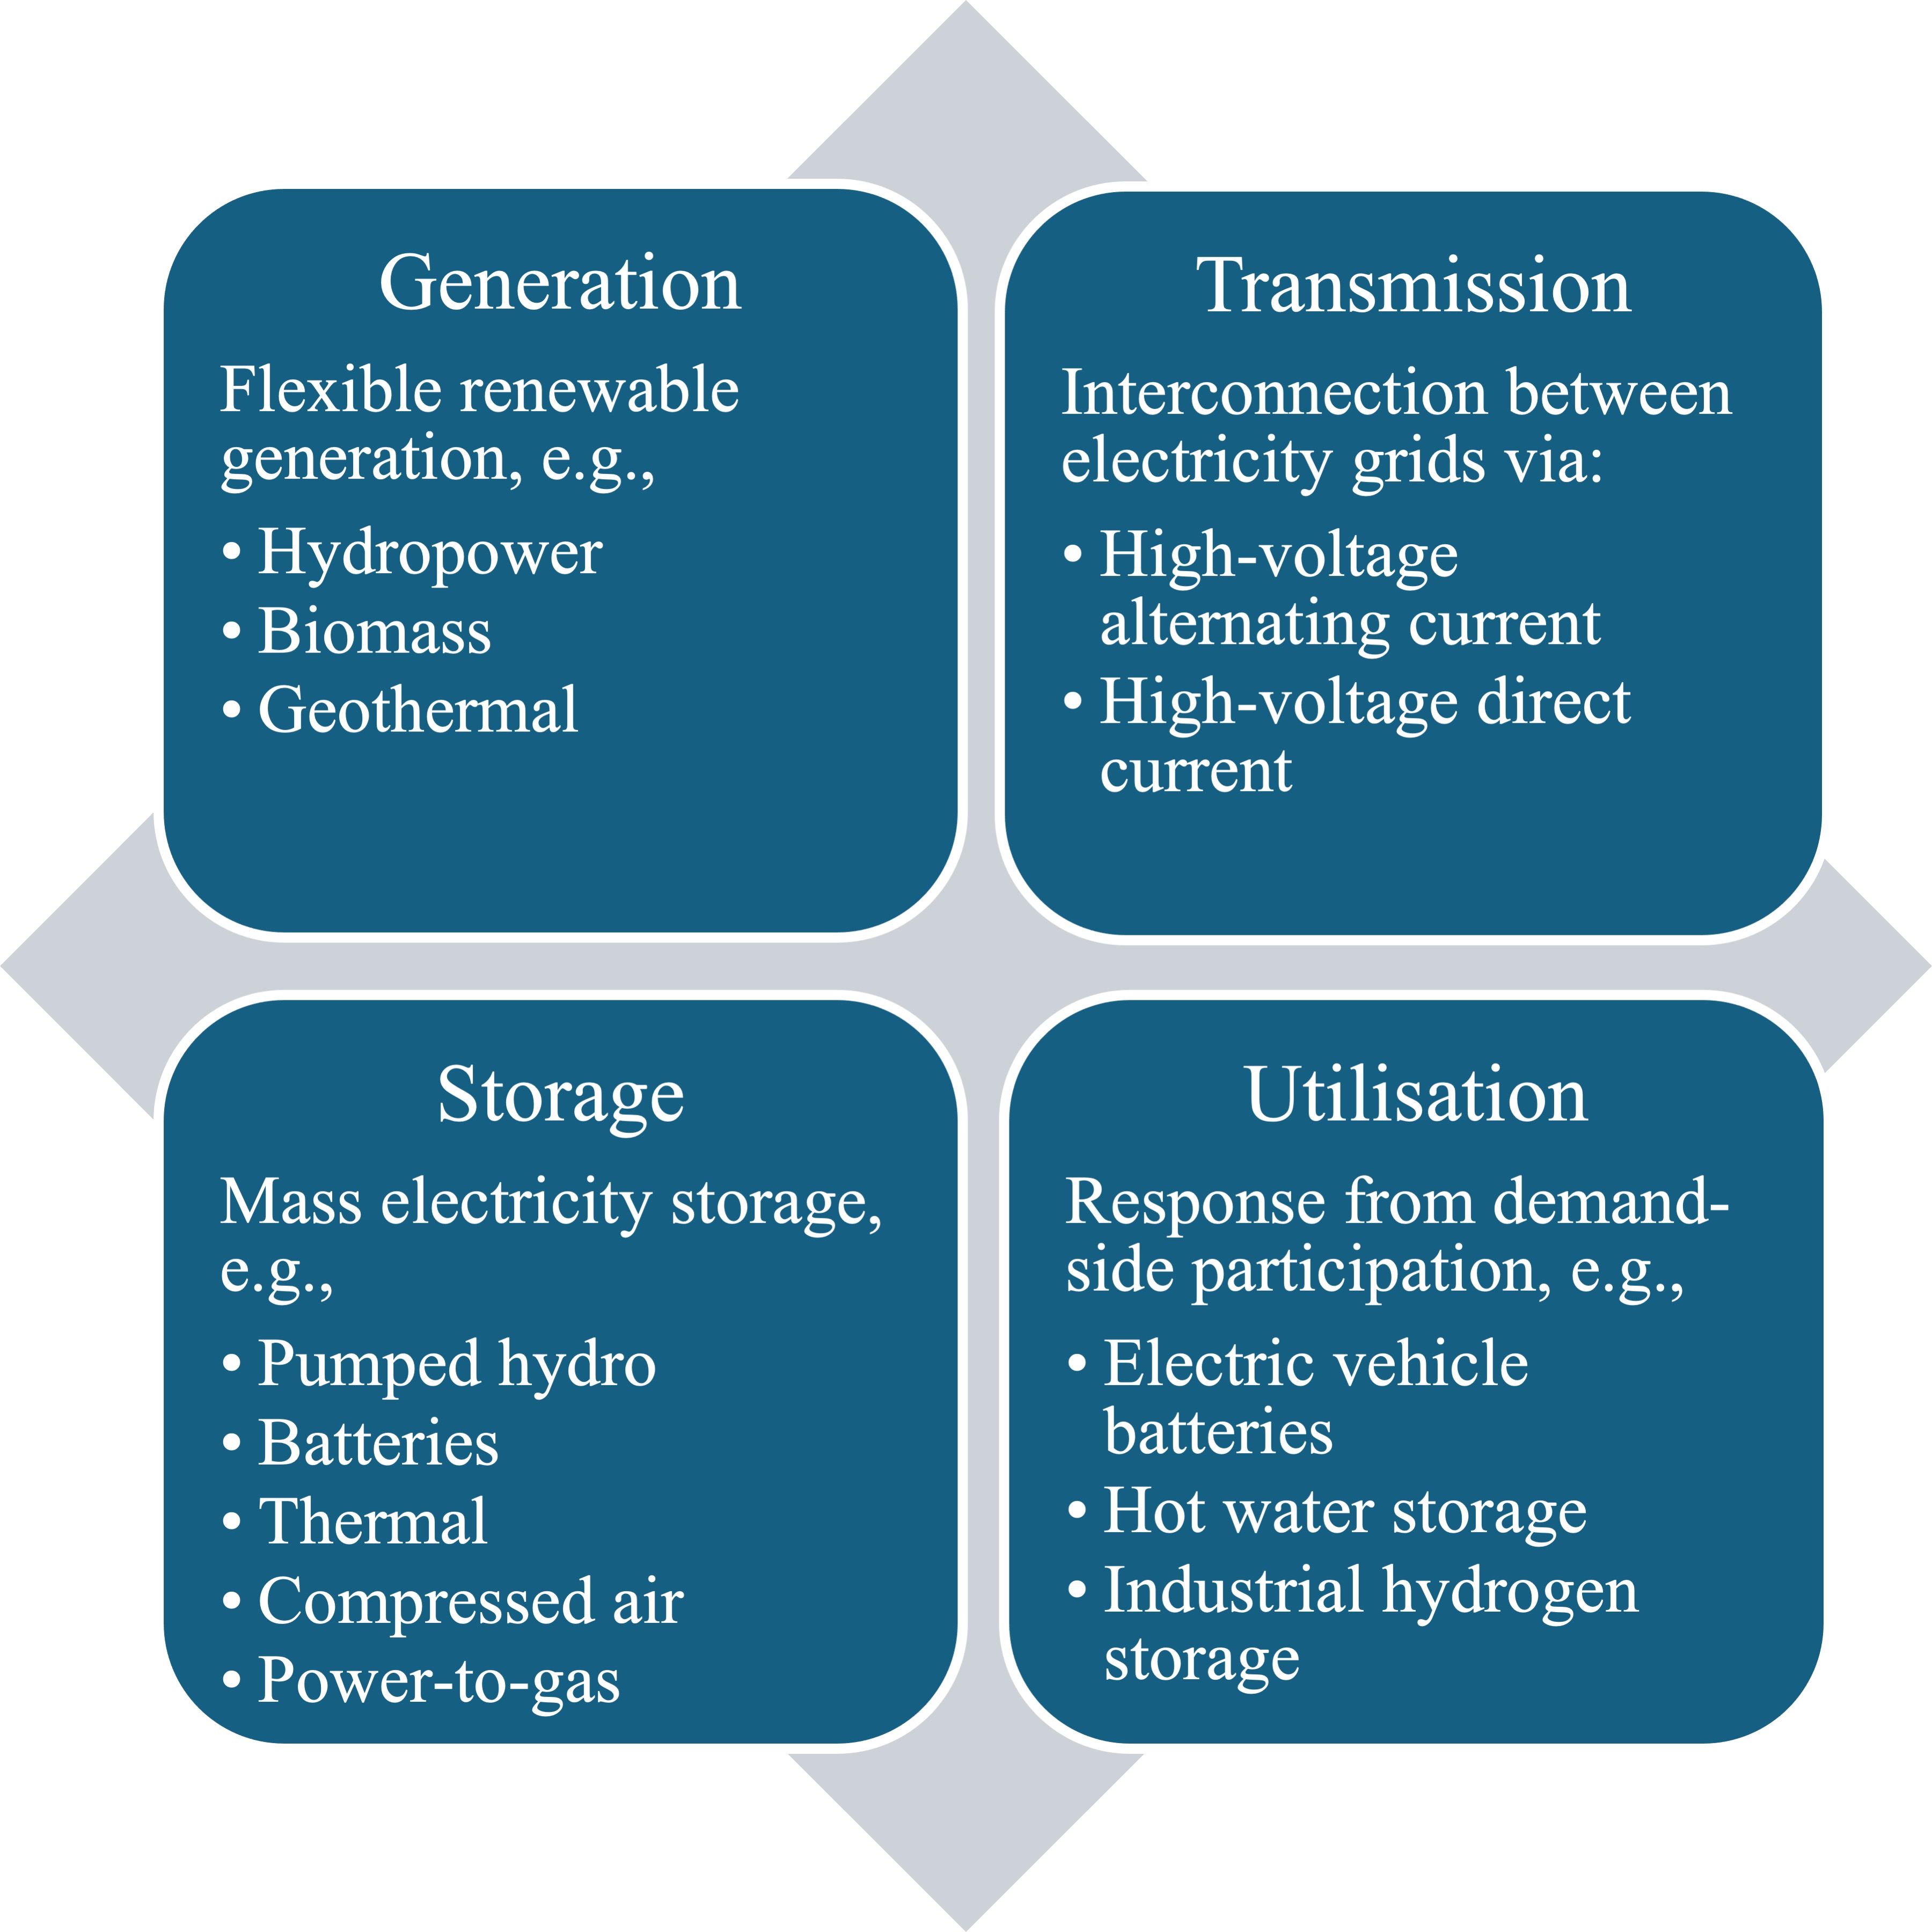
Figure 5. System-wide flexibility enabled by the FIRM strategy across renewable energy generation, transmission, storage, and utilisation.
4.1 Flexible Renewable Generation
In today's electricity grids, the flexibility is provided by the coordinated dispatch of baseload (e.g., coal and nuclear power), load-following, and peaking power plants (e.g., natural gas and hydropower). In future 100% renewable grids, the flexibility can be sourced from dispatchable renewables, e.g., hydropower, biomass, and geothermal energy. These technologies can offer higher operational flexibility than solar and wind power, particularly in meeting energy balance requirements. Hydropower, biomass, and geothermal units typically respond on minute-to-hour timescales while also providing synchronous inertia to support grid stability. Therefore, they can complement solar and wind power, helping address the challenges of renewable energy integration into electricity grids.
Hydropower can be classified into storage and run-of-river hydroelectric plants, with a particular type, pumped hydro storage (discussed in Section 4.4). Due to its fast ramping capabilities, hydropower plays a critical role in maintaining system stability through energy balancing and frequency regulation. In 2024, global hydropower capacity reached 1425 GW, accounting for 32% of renewable generation capacity [1]. Gernaat et al. [35] conducted a global assessment of hydropower potential using 15″ x 15″ discharge maps and 3″ x 3″ digital elevation models with a 25 km search interval along river systems. It estimated the remaining hydropower potential at 3.29 PWh annually, after accounting for economic feasibility and ecological restrictions. However, these resources are unevenly distributed worldwide, with the largest remaining potential located in the Asia-Pacific, South America and Africa. In 2022, the top 10 hydropower-producing countries generated nearly three-quarters of global hydropower output [36], highlighting the regional concentration of hydropower development.
Bioenergy utilises organic matter from plant and animal sources for energy applications, including direct combustion for heating, electricity generation, and the production of transport fuels. Biomass can serve as a carbon feedstock for renewable electro-fuels, e.g., methanol, dimethyl ether and methane, through thermochemical gasification and hydrogenation processes. Electricity generation from bioenergy is achieved through biomass- or biogas-fired power, or by co-firing with coal in thermal power plants. Bioenergy can be considered carbon-neutral, if the CO2 emitted during energy conversion is fully offset by CO2 uptake during plant growth through photosynthesis. On the other hand, biomass combustion contributes to particulate matter and increased ozone-related health hazards. In 2024, bioenergy-based electricity generation reached 151 GW of installed capacity, accounting for about 3% of global renewable generation capacity. The leading countries in bioenergy-based electricity generation included China (33 GW), Brazil (18 GW), India (11 GW), the United States (11 GW), and Germany (10 GW) [1].
Geothermal energy, derived from the heat stored within the Earth's crust, can be used for direct heating, ground-source heat pumps, and electricity generation. Electricity generation from geothermal energy is viable for medium- to high-temperature resources, i.e., >100 °C. Conventional geothermal resources are convective hydrothermal systems located in the regions with active volcanoes, e.g., the west coast of the United States, New Zealand, and Indonesia along the Pacific Ring of Fire. In contrast, emerging geothermal technologies include hot sedimentary aquifers and engineered geothermal systems, which involve enhancing permeability by engineering fracture systems to access the heat stored in basement rocks. Geothermal power can operate at a high capacity factor (e.g., 80%), providing baseload power with low fluctuations [37]. In 2024, global geothermal power capacity reached 15 GW, accounting for 0.3% of total renewable generation capacity.
Despite offering high operational flexibility, the development of hydropower, biomass, and geothermal energy is usually constrained by environmental, social, and economic factors. Large-scale hydropower development can pose significant environmental challenges, including ecosystem disruption, biodiversity loss, nutrient cycle disturbances, and landscape modifications, as well as social impacts, e.g., the relocation of local residents [35,38]. Hydropower resources are also limited by river flow variability, affected by competing demands for agricultural irrigation and ecological conservation. Bioenergy development for electricity generation has a range of challenges [39]. Land-use competition remains a major concern, as biomass production competes with food crops, animal feed, and material markets. Excessive biomass harvest can cause land degradation, including nutrient depletion, soil structure deterioration, and reduced water retention capacity. Additional environmental concerns, e.g., deforestation and habitat loss, further limit the long-term sustainability of bioenergy. The availability of biomass feedstock, e.g., agricultural residues, wood, organic wastes, and energy crops, is also subject to seasonal variability. Geothermal energy is geographically limited and depends on favourable geological conditions. Consequently, regions with limited access to hydropower, biomass, and geothermal energy need alternative strategies to support high-renewable grids, as discussed in Sections 4.2, 4.3, and 4.4.
4.2 Interconnection between Electricity Grids
Solar and wind energy resources are geographically diverse; thus, aggregating renewable generation across wider geographic areas can smooth out the impacts of local weather variability. Grid interconnection is a key enabler of this aggregation, helping manage the variability and uncertainty of renewable energy. Electricity grids are interconnected using high-voltage alternating current (HVAC) and high-voltage direct current (HVDC) technologies. HVAC is currently the dominant form due to its ability to readily transform voltage levels via electromagnetic induction, allowing efficient transmission across different voltages.
As power electronics technology advances, HVDC is playing a growing role in modern electricity grids. Compared to HVAC technology, HVDC offers several competitive advantages. Firstly, HVDC eliminates reactive power losses, which are inherent in HVAC transmission due to the inductive and capacitive effects. Secondly, HVDC avoids the skin effect, while AC current tends to concentrate near the conductor surface leading to increased electrical resistance. Thirdly, frequency-related losses, e.g., corona losses, are significantly lower using HVDC technology. As a result, HVDC transmission has low energy losses over long distances, typically around 3% per 1000 km, at least twice as efficient as HVAC transmission [40]. From a cost perspective, HVAC transmission has lower terminal costs but higher line costs. In contrast, HVDC transmission requires higher terminal costs for converter stations but benefits from lower line costs, due to reduced conductors, tower structures, and right-of-way requirements. The breakeven distance (beyond which HVDC transmission becomes more cost-efficient) typically ranges between 500 and 1000 km for overhead lines and between 50 and 100 km for submarine and underground cables.
Due to its efficiency and cost advantages, HVDC is well-suited for long-distance, high-capacity electricity transmission. For example, China's Changji-Guquan Ultra-HVDC project is by far the world's most powerful transmission project, capable of delivering 12 GW of power over 3000 km at 1100 kV [41]. HVDC is also ideal for submarine and underground electricity transmission. An example is the North Sea Link, one of the world's longest submarine power cables, connecting the Norwegian and British electricity grids using HVDC technology [42]. By eliminating capacitive losses, HVDC technology significantly increases the effective transmission capacity of underground or submarine power cables.
A significant advantage of HVDC interconnection is its ability to "decouple" interconnected HVAC grids through AC-DC-AC conversions. This avoids faults in one grid from rapidly spreading to others, enhancing energy security across interconnected electricity grids. For example, during the 2003 North American blackout [43], the Quebec grid remained stable due to its connection to the U.S. via HVDC transmission, while Ontario experienced major outages as the fault spread through synchronously interconnected HVAC grids with the U.S.
4.3 Response from Demand-side Participation
As transport and heating become increasingly electrified, a significant amount of demand-side storage resources are being embedded into electricity grids. These resources include electric vehicle batteries, thermal storage in electric water heating, residential and commercial batteries. These storage resources contribute substantial demand-side flexibility, enabling real-time energy balancing and higher uptake of variable renewables. Compared to centralised storage solutions, demand-side storage resources have the advantage of being integrated within distribution networks and co-located with energy end-use. This enables renewable energy to be stored as chemical energy in batteries and as heat in hot water storage, allowing direct consumption at the consumer level and reducing transmission and conversion losses. Importantly, demand-side storage can help alleviate network constraints arising from electrification and renewable energy integration. By strategically operating storage systems, existing grid infrastructure can be used more efficiently, deferring the need for costly upgrades. Demand response mechanisms have traditionally relied on consumer-driven behavioural changes, e.g., shifting energy-intensive activities (e.g., running washing machines, dryers, and dishwashers) to off-peak hours. However, these changes are constrained by consumer lifestyles and participation levels. In contrast, demand-side storage offers higher operational flexibility without relying on behavioural changes. These storage resources act as a buffer, charging during periods of low electricity prices and discharging during peak demand periods, thus facilitating effective load shifting and peak shaving.
For indirect electrification in industry, hydrogen and electro-fuel production can provide significant demand-side flexibility. By integrating hydrogen storage into industries, e.g., green ammonia production, green steelmaking, and the manufacture of green fuels, it can create industrial load centres that are interruptible, dispatchable, and highly responsive to changes in energy balance. These industrial facilities can function as flexible loads through adjusting their consumption in real time to help address renewable energy variability. Therefore, hydrogen storage can be a critical enabler of industrial flexibility, supporting both grid stability and the scaling up of renewable energy use in industry. Compared to electric vehicle batteries and hot water storage, which mainly operate on diurnal timescales, hydrogen storage can provide flexibility across a wide range of timescales from minutes to months. Assuming a hydrogen storage buffer of 24 h, a Mt-scale green hydrogen industry could provide 150 GWh of demand-side flexibility to electricity grids. Further, if the storage capacity extended to one week, the flexibility level that a Mt-scale green hydrogen industry delivers could exceed 1000 GWh.
4.4 Mass Electricity Storage
Mass electricity storage absorbs excess renewable generation and releases it back into the grid during periods of supply shortfall or high demand. It converts electricity into various forms of energy for storage, including:
• Gravitational potential energy of water, i.e., pumped hydro, where electricity is used to pump water to an upper reservoir and recovered by releasing water through hydropower turbines.
• Thermal energy, where electricity is converted into high-temperature heat, later converted back into electricity using steam or gas turbines.
• Chemical energy via electrochemical processes, where electricity is stored in chemical form within batteries, e.g., lead-acid, nickel-cadmium, lithium-ion, sodium-sulfur, and redox flow batteries.
• Chemical energy via power-to-gas, where electricity is used to produce hydrogen or electro-fuels that can later be converted back into electricity.
• Elastic potential energy of air, i.e., compressed air energy storage, where electricity is used to compress air stored in caverns or tanks, later released to drive turbines for electricity generation.
• Rotational kinetic energy, e.g., flywheels, which store energy as rotational motion.
• Electromagnetic energy, including supercapacitors storing energy in electric fields, and superconductors storing energy in magnetic fields.
Electricity storage technologies can be evaluated based on key metrics, e.g., energy density, round-trip efficiency, cost, storage duration, and response time. Pumped hydro and lithium-ion batteries are currently the leading technologies for mass electricity storage, offering high efficiency and relatively low storage costs. Pumped hydro can achieve a round-trip efficiency of 80% [44], while lithium-ion batteries can range from 90% to 95% [45]. Pumped hydro remains among the most cost-efficient electricity storage options, with capital costs ranging from tens to hundreds of US$ per kWh of storage capacity. In comparison, lithium-ion batteries typically cost several hundred US$ per kWh of storage capacity, though their costs are falling rapidly. According to IRENA [11], the global average cost of utility-scale batteries fell by 89%, from US$2511/kWh in 2010 to US$273/kWh in 2023. Pumped hydro can operate for over 50 years, with dams and reservoirs typically designed for a service life of 100 years [46]. Lithium-ion batteries, by contrast, have operational lifespans of up to 20 years [47], limited by capacity fade and cycle-related degradation. For example, a degradation rate of 1.8% per year can result in a 30% capacity loss over a 20-year lifespan. Pumped hydro development requires favourable geographic, geological and hydrological conditions, e.g., adequate elevation differences, suitable geology, and compliance with environmental and land-use regulations [48]. Lithium-ion batteries provide high locational flexibility and can be readily integrated into residential, commercial and industrial applications, with capacities ranging from kWh to GWh. Pumped hydro can provide synchronous inertia and ramp up or down within minutes, while lithium-ion batteries offer millisecond-scale response capabilities. Therefore, their roles can be complementary in supporting frequency regulation, voltage control, and fast response in high-renewable grids.
Other electricity storage technologies have not been widely deployed, due to their relatively low round-trip efficiencies and/or higher storage costs. Nevertheless, technological advances are improving their economic viability, enabling broader adoption in grid-scale applications. A new alkaline capillary-fed electrolysis cell was reported to achieve a cell energy efficiency of 98% [49]. New closed-cycle gas turbines, which can be integrated with thermal energy storage, achieved a thermal efficiency exceeding 70% [50]. For compressed air energy storage, the round-trip efficiency of adiabatic systems can exceed 70% by capturing and reusing the heat generated during air compression [51]. As a result, the round-trip efficiencies of hydrogen, thermal, and compressed air energy storage technologies can improve to the 50%–75% range. Meanwhile, flywheels, supercapacitors, and superconductors can provide ancillary services, supporting frequency regulation and the mitigation of transient disturbances in high-renewable grids.
5.1. Modelling Framework
Energy balance modelling is essential for evaluating the reliability and affordability of 100% renewable grids. It also plays a key role in: (i) developing strategies for stabilising electricity grids to facilitate large-scale integration of solar and wind power; (ii) investigating trade-offs between energy storage (energy time-shifting) and electricity grid interconnection (energy geo-shifting); and (iii) identifying stressful periods when renewable energy is constrained while electricity demand is high. Existing energy balance models are typically formulated as linear programming or mixed-integer linear programming problems, which become computational intractable when extended to long-term chronological modelling due to the exponential increase in the number of decision variables.
To solve this problem, a non-linear net-load method is developed. As shown in Eqs. (1) to (8), the discharge, charge and state-of-charge of mass electricity storage, DMass(j, t), CHMass(j, t), SMass(j, t), and the corresponding variables for demand-side responses (e.g., electric vehicle batteries), DResponse(j, t), CHResponse(j, t) and SResponse(j, t), are determined according to the net load in region j at time interval t, ENLoad(j, t). When ENLoad(j, t) > 0, storage systems discharge to fill the gap between renewable energy supply and electricity demand. When ENLoad(j, t) < 0, storage systems store excess solar and wind power until reaching their capacity limits. ELoad(j, t) is the electric load in region j at time interval t. EResponse(j, t) represents the demand-side responses which can dynamically adjust according to energy balance, e.g., charging of electric vehicles. This flexibility is constrained by the energy need, ENeed(j, t), and a minimum state-of-charge level. ESpillage(j, t) and EDeficit(j, t) represent the energy spillage and deficit, respectively. CMassP(j) and CMassS(j) represent the power and storage capacities of mass electricity storage, while CResponseP(j) and CResponseS(j) represent the power and storage capacities of demand-side responses. EFMass and EFResponse refer to the efficiencies of mass electricity storage and demand-side responses, respectively. GVRE(i, t) and GFlexible(j, t) represent the generations from variable renewables (e.g., solar and wind power) and flexible renewables (e.g., hydropower, biomass and geothermal) within renewable energy zone i, summed to a region level. EImport(j, t) is determined based on the network topology and regional energy balancing requirements. DMass(j, t), CHMass(j, t), DResponse(j, t), CHResponse(j, t), ENLoad(j, t), ELoad(j, t), EResponse(j, t), ENeed(j, t), ESpillage(j, t), EDeficit(j, t), CMassP(j), CResponseP(j), GVRE(i, t), GFlexible(j, t), and EImport(j, t) are measured in MW, while SMass(j, t), SResponse(j, t), CMassS(j), and CResponseS(j) are measured in MWh.
Solar and wind power outputs, GVRE(i, t), are inflexible and determined by the installed capacities, CVRE(i), and high-resolution generation traces, TSVRE(i, t). In contrast, electricity generation from flexible resources, GFlexible(j, t), can be flexibly dispatched in coordination with energy storage to support energy adequacy during stressful periods. However, the calculation of GFlexible(j, t) requires a forward-looking assessment of energy sufficiency over days or even weeks in a rolling window, which is computationally impractical.
Therefore, a two-step modelling approach is developed to address this problem, as illustrated in Figure 6. In Step 1, a candidate solution is input into the model with the decision variables, CVRE(i), CMassP(j) and CMassS(j). The net load, 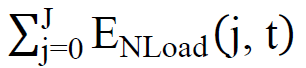 , is calculated as the difference between electricity demand, ELoad(j, t), EResponse(j, t), and renewable energy supply calculated from TSVRE(i, t). GFlexible(j, t) is initially set to zero, and the energy requirement for flexible renewable generation,
 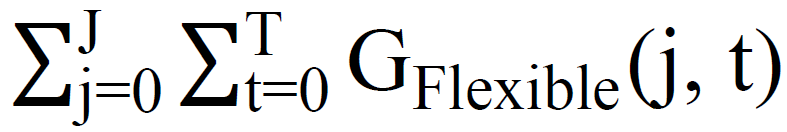 , is estimated based on energy deficiency. The requirement for interconnection, TInter(k, t), is estimated from the resulting power flows on the electricity grids. GFlexible(j, t) is then set to the full capacity, and the total energy deficit,
 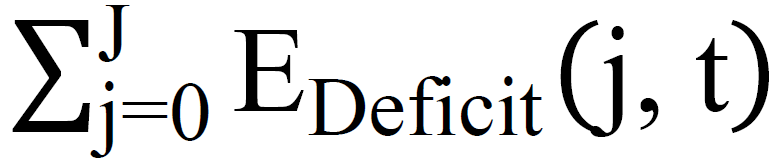 , is calculated. The LCOE for the candidate solution is calculated based on the cost assumptions. If the candidate solution violates the modelling constraints, then a cost penalty is applied, making the candidate solution less preferable.
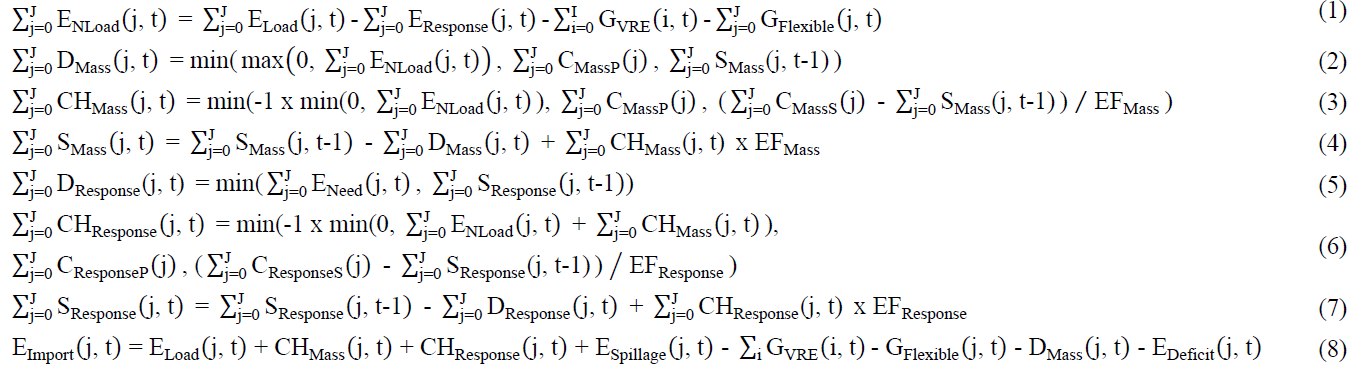
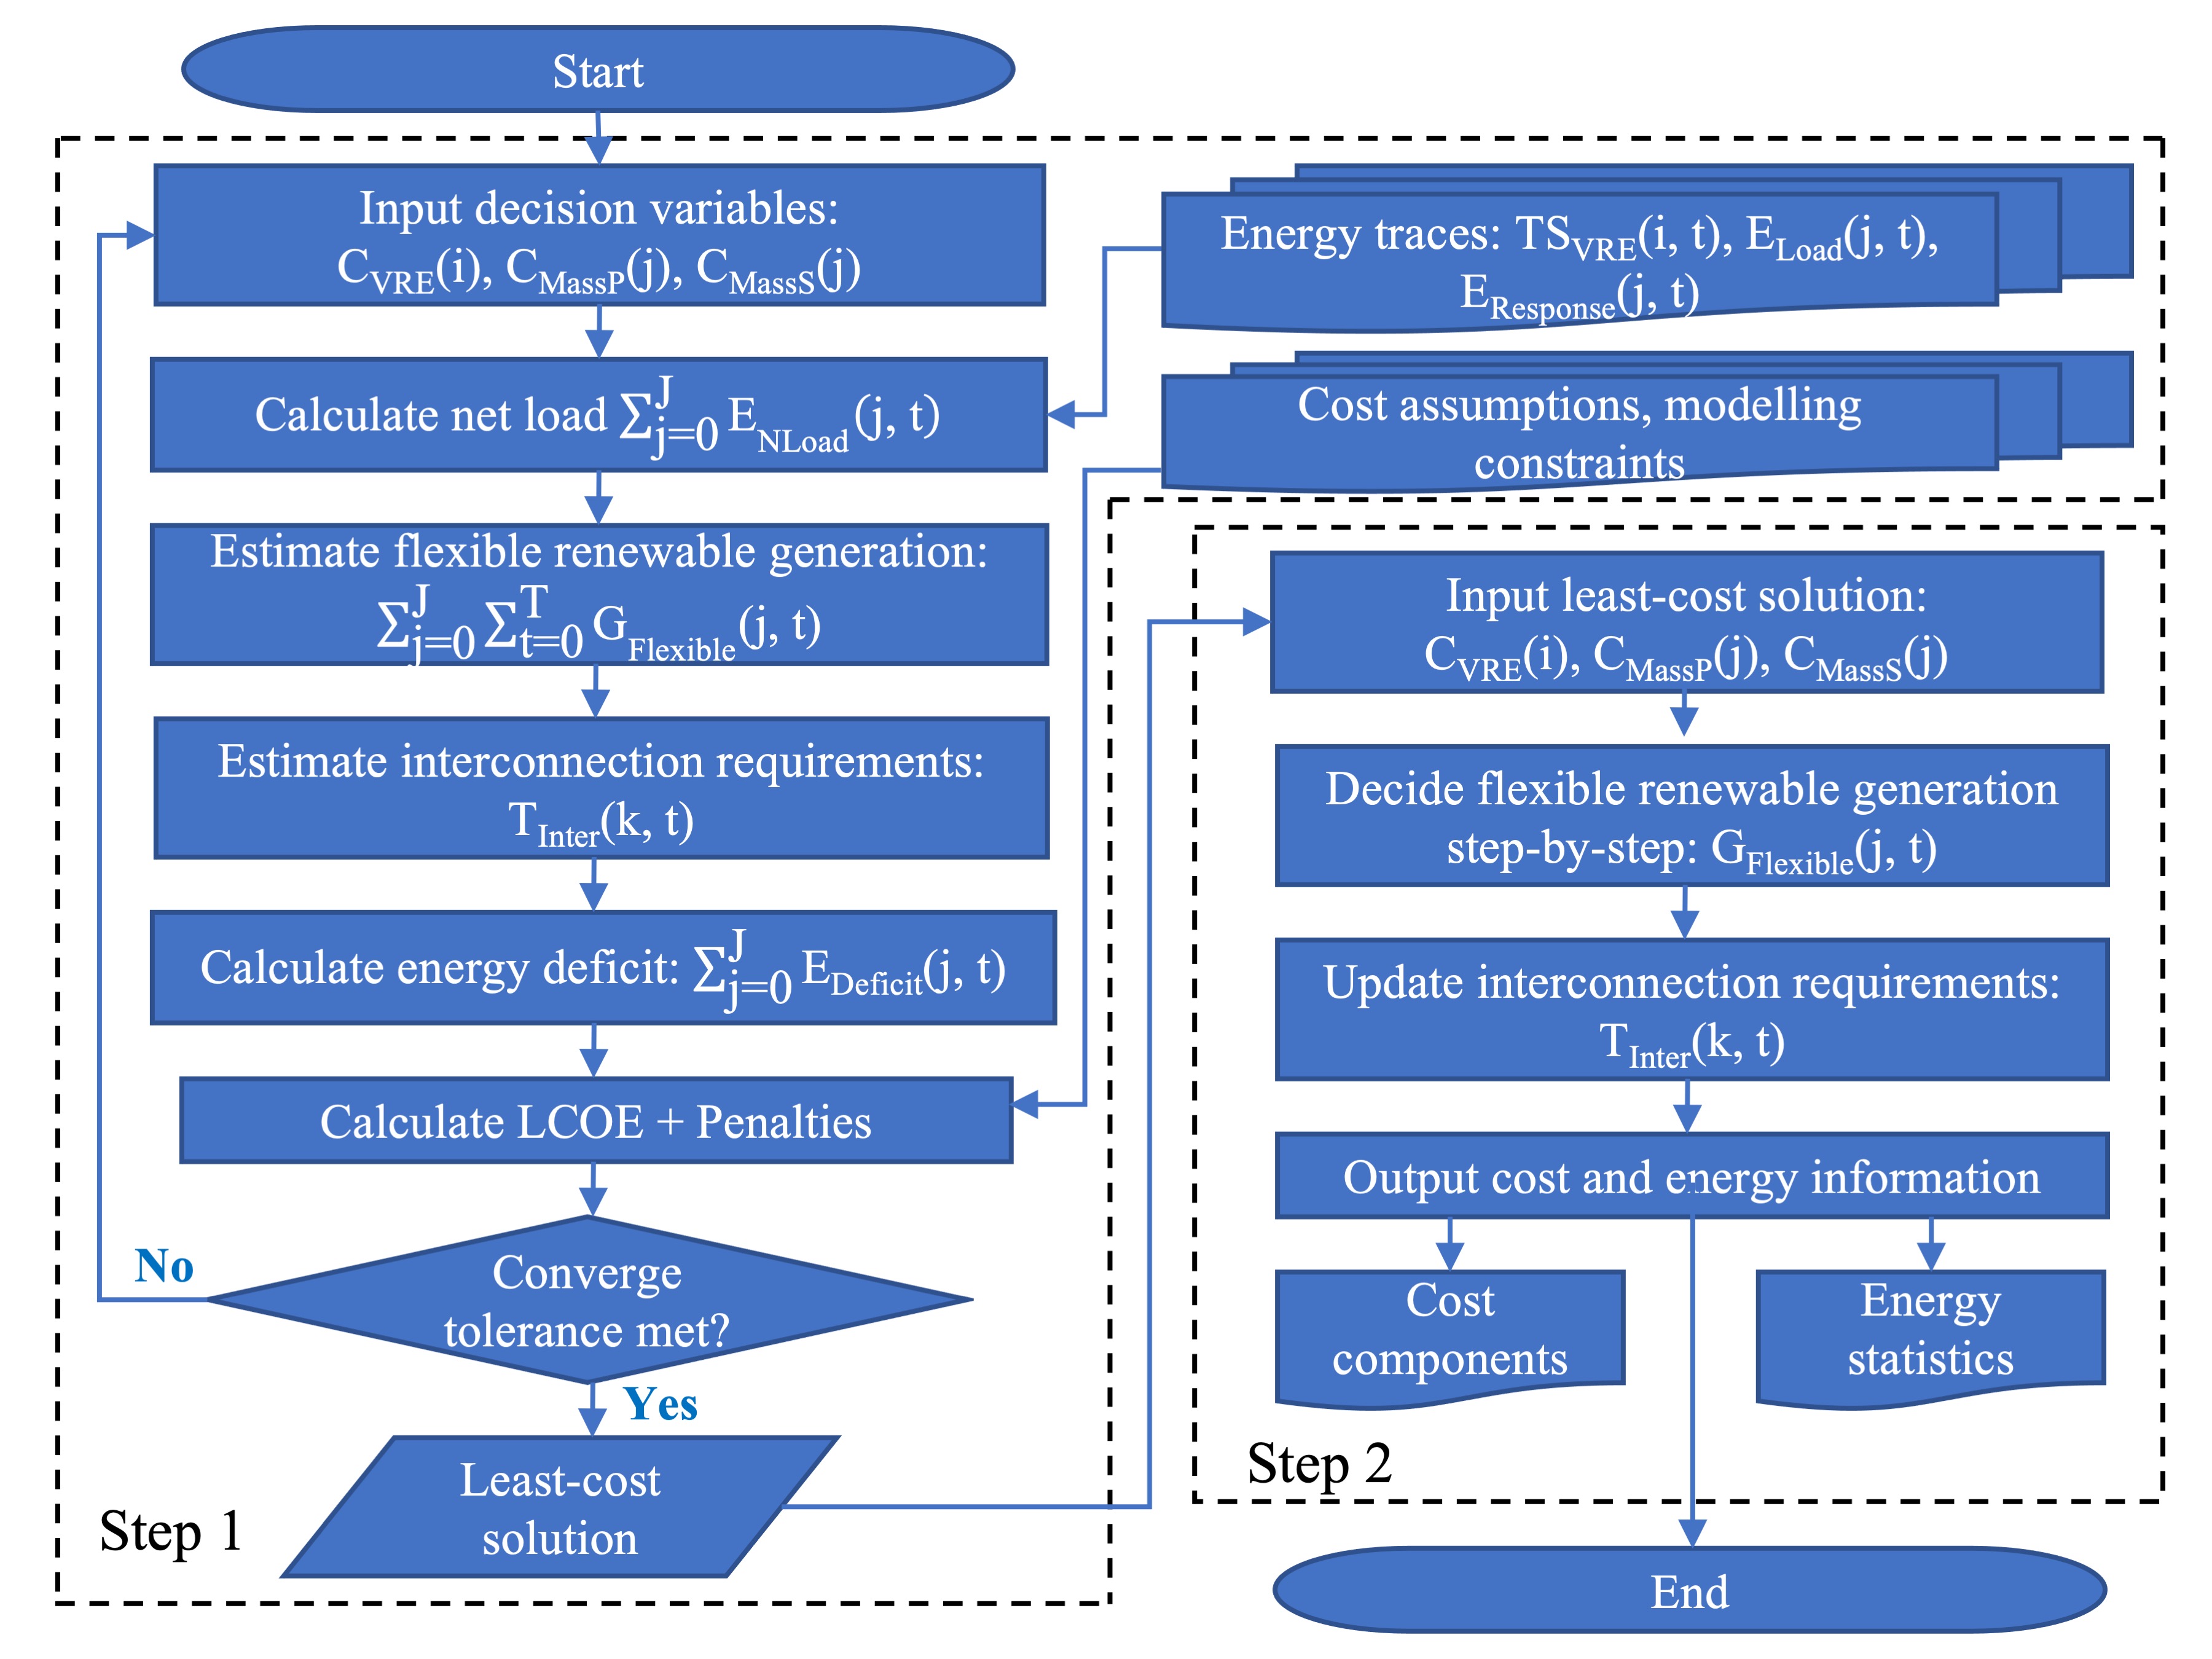
Figure 6. Flowchart of the two-step energy balance modelling framework approach incorporating with the FIRM strategy.
In the modelling, the Differential Evolution algorithm finds the least-cost solution from the candidate solutions in a heuristic process. This algorithm is highly capable of solving non-linear optimisation problems, offering robust performance in searching complex high-dimensional solution spaces with continuous decision variables. The ability to rapidly converge in non-convex settings supports its application in addressing the computational complexity of long-term chronological energy modelling. In Step 1, a rough estimate of the energy requirement for flexible renewable generation, 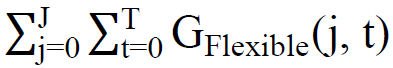 , and the interconnection flows, TInter(k, t), is also estimated. In a 100% renewable grid dominated by solar and wind power, flexible renewable generation typically accounts for a small fraction of the total electricity generation; thus, the “roughness” in the optimisation is usually acceptable. In Step 2, GFlexible(j, t) is recalculated using a step-by-step analysis of energy adequacy in a rolling outlook window, applied only to the least-cost solution from Step 1. The lengths of timestep (e.g., hourly) and rolling window (e.g., one month) can be defined as modelling inputs. TInter(k, t) is then recalculated. Finally, the cost and energy information are output from the model. The key advantage of this two-step modelling approach is that the computationally intensive scheduling of flexible renewable generation in Step 2 is separated from the heuristic optimisation process in Step 1.
5.2. Case Studies
The modelling framework has been applied to the analysis of high-renewable grids in Australia and the broader Asia-Pacific region. These studies demonstrated how enabling system-wide flexibility through the FIRM strategy can effectively stabilise 100% renewable grids across diverse regional contexts.
For Australia [3], the modelling evaluated three 100% renewable electricity scenarios: (i) 7 Grids, where independent state-based grids without interconnection resulted in a high LCOE averaging A$99/MWh, with total storage requirements of 65 GW and 2049 GWh; (ii) Super Grid, where HVDC interconnections between states reduced the LCOE to A$75–A$88/MWh and storage requirements to 481–746 GWh; and (iii) Smart Grid, which added demand-side participation through flexible electric vehicle charging, further reducing LCOE to A$70–A$82/MWh and storage requirements to 321–493 GWh. These results showed that integrating system-wide flexibility can significantly lower electricity costs and energy storage requirements. In these scenarios, solar and wind power contributed 72%–95% of electricity generation, with pumped hydro and batteries ensuring energy balance. Full electrification of heating, transport, and industry with 100% renewable electricity could help cut Australia’s emissions by up to 80%.
For the Asia-Pacific region [52], where energy demand is rising rapidly and fossil fuel reserves are limited, the modelling showed that Southeast Asia can achieve 78%–97% penetration of solar and wind power through implementing the FIRM strategy. The LCOE of 100% renewable electricity across countries ranged from US$55–US$115/MWh. An intercontinental Super Grid scenario with HVDC links across Southeast Asia and extending to Australia, China, and India, reduced storage requirements by 50%–89%, and the LCOE changed in the range of −4% to +7%. In the high demand scenario (assuming all countries reached Singapore’s per-capita electricity use), storage requirements were estimated at 2394 GW and 44,707 GWh, while the Super Grid helped reduce storage requirements to 1170–1480 GW and 15,506–22,299 GWh. This showed a trade-off between energy storage and electricity grid interconnection. Transitioning to 100% renewable electricity in Southeast Aisa helps avoid 1551 Mt–4401 Mt of carbon emissions every year and about 100,000 premature deaths annually caused by air pollutants from coal-fired power.
Overall, the modelling demonstrated the techno-economic advantages of the integrated FIRM strategy for stabilising 100% renewable grids. The modelling framework showed high efficacy in analysing large-scale, interconnected grids, highlighting substantial energy, economic and environmental benefits of transitioning to renewable energy futures. The case studies demonstrated the value of the modelling framework in informing evidence-based policymaking for global energy transitions. The research findings have directly supported policy development and strategic planning by providing data-driven insights to government and industry stakeholders.
Achieving 100% renewable grids is now within reach both technically and economically; however, it introduces significant operational complexities. Solar and wind power are the fastest-growing sources of new electricity generation, but they are inherently variable, uncertain, and integrated into the grid via inverter-based interfaces. These characteristics challenge grid stability and resilience, particularly under the impacts of climate change-driven extreme weather events.
This article proposes the FIRM strategy as a comprehensive system design framework to address the technical challenges of high-renewable grids. By integrating Flexible renewable generation, Interconnection of electricity grids, Response from demand-side participation, and Mass electricity storage, this integrated strategy unlocks system-wide flexibility across both temporal and spatial timescales, supporting the resilience of high-renewable grids primarily powered by solar and wind power. A key methodological innovation is a new two-step energy balance modelling approach that combines heuristic optimisation with high-resolution chronological simulation. This overcomes the limitations of conventional models, enabling efficient simulation of 100% renewable grids. Case studies in Australia and the Asia-Pacific demonstrated that the FIRM strategy can help reduce electricity costs and energy storage requirements, while effectively stabilising 100% renewable grids. Demand-side flexibility, particularly from electric vehicle batteries, provides significant load shifting capacity, while electricity grid interconnection can reduce the need for extensive energy storage.
Given uncertainties in key inputs, e.g., energy technologies, costs, and policy trajectories, the modelling uses multi-year, high-resolution meteorological data with a range of electricity demand scenarios to capture temporal and spatial variability. Future work could extend the analysis by applying uncertainty analysis methods, e.g., Monte Carlo simulation, to assess how system configurations shift across diverse technological, economic, and policy scenarios. The current modelling framework provides a robust foundation for future extensions and is highly adaptable to a wide range of regional contexts and decarbonisation pathways.
The research findings highlight the value of embedding system-wide flexibility as a core principle in high-renewable grid planning. Policy measures should prioritise interregional grid interconnection, incentives for demand-side participation, and the deployment of flexible renewable generation and energy storage. Regulatory frameworks must evolve to support integrated, cross-sectoral planning aligned with the FIRM strategy, ensuring that electricity grids are stable, resilient and supportive of long-term emission reduction targets.
The datasets for Figures 1–4 and the code for the case studies are available on GitHub: https://github.com/b-lu.
The author gratefully acknowledges funding support from the Zero-Carbon Energy for the Asia-Pacific Grand Challenge initiative at the Australian National University. This support was instrumental in the development of the FIRM strategy presented in this article.
The author declares no conflicts of interest.
International Renewable Energy Agency, Renewable Capacity Statistics 2025, 2025.
Graham, P., Hayward, J. and Foster J. 2024, GenCost 2023‐24: Final report, CSIRO, Australia.
Lu, B., Blakers, A., Stocks, M., Cheng, C., Nadolny, A. A zero-carbon, reliable and affordable energy future in Australia. Energy 2021, 220, 119678. doi: 10.1016/j.energy.2020.119678.
California Independent System Operator, Final Root Cause Analysis: Mid-August 2020 Extreme Heat Wave, 2020.
Electric Reliability Council of Texas, February 2021 Extreme Cold Weather Event: Preliminary Report on Causes of Generator Outages and Derates, 2021.
Victorian Government, Network Outage Review: February 2024 Storm and Power Outage Event, 2024.
Hunter, C.A., Penev, M.M., Reznicek, E.P., Eichman, J., Rustagi, N., Baldwin, S.F. Techno-economic analysis of long-duration energy storage and flexible power generation technologies to support high-variable renewable energy grids. Joule 2021, 5, 2077–2101. doi: 10.1016/j.joule.2021.06.018.
Tong, D., Farnham, D.J., Duan, L., Zhang, Q., Lewis, N.S., Caldeira, K., Davis, S.J. Geophysical constraints on the reliability of solar and wind power worldwide. Nature Communications 2021, 12, 6146. doi: 10.1038/s41467-021-26355-z.
Guo, F., Ruijven, B.J., Zakeri, B., Zhang, S.N., Chen, X., Liu, C.Y., Yang, F., Krey, V., Riahi, K., Huang, H., Zhou, Y.B. Implications of intercontinental renewable electricity trade for energy systems and emissions. Nature Energy 2022, 7, 1144–1156. doi: 10.1038/s41560-022-01136-0.
European Commission. Joint Research Centre. and IEA., GHG emissions of all world countries, 2024. Available online:
International Renewable Energy Agency, Renewable Power Generation Costs in 2023, 2024.
International Energy Agency, World Energy mix. Available online:
Ge, M., Friedrich, J., Vigna, L. Where Do Emissions Come From? 4 Charts Explain Greenhouse Gas Emissions by Sector, May 2024. Available online:
Jacobson, M.Z., Krauland, A.K., Coughlin, S.J., Dukas, E., Nelson, A.J.H., Palmer, F.C., Rasmussen, K.R. Low-cost solutions to global warming, air pollution, and energy insecurity for 145 countries. Energy & Environmental Science 2022, 15, 3343–3359. doi: 10.1039/D2EE00722C.
Lelieveld, J., Haines, A., Burnett, R., Tinne, C., Klingmüller, K., Münzel, T. Air pollution deaths attributable to fossil fuels: observational and modelling study. BMJ 2023, 383, e077784. doi: 10.1136/bmj-2023-077784.
Energy Institute, 2024 Statistical Review of World Energy, 2024.
International Energy Agency, World Energy Outlook 2024, 2024.
Sørensen, B. CHAPTER 2 - THE ORIGIN OF RENEWABLE ENERGY FLOWS. In Renewable Energy, 3rd ed.; Sørensen, B., Ed.; Academic Press: Burlington, USA, 2004, pp. 29–209. doi: 10.1016/B978-012656153-1/50018-2.
Net Zero Tracker. Available online:
U.S. Government, The United States of America Nationally Determined Contribution Reducing Greenhouse Gases in the United States: A 2035 Emissions Target, 2024.
International Energy Agency, Net Zero by 2050 - A Roadmap for the Global Energy Sector, 2021.
Global Solar Atlas. Available online:
Lawrence Berkeley National Laboratory, Land-Based Wind Market Report 2024 Edition, 2024.
Australian Government, NationalMap. Available online:
Hodge, B.-M., Milligan, M. Wind power forecasting error distributions over multiple timescales. In Proceedings of 2011 IEEE Power and Energy Society General Meeting, Detroit, MI, USA, 24–28 July 2011; pp. 1–8. doi: 10.1109/PES.2011.6039388.
Price, I., Sanchez-Gonzalez, A., Alet, F., Andersson, T.R., El-Kadi, A., Masters, D., Ewalds, T., Stott, J., Mohamed, S., Battaglia, P., Lam, R., Willson, M. Probabilistic weather forecasting with machine learning. Nature 2025, 637, 84–90. doi: 10.1038/s41586-024-08252-9.
Clean Energy Council, Clean Energy Australia 2024.
Australian Energy Market Operator, 2023 Inertia Report, 2023.
European Network of Transmission System Operators for Electricity, Inertia and Rate of Change of Frequency (RoCoF) Version 17, 2020.
Open Electricity: South Australia. Available online:
Intergovernmental Panel on Climate Change (IPCC), Ed., Weather and Climate Extreme Events in a Changing Climate. In Climate Change 2021 – The Physical Science Basis: Working Group I Contribution to the Sixth Assessment Report of the Intergovernmental Panel on Climate Change, Cambridge University Press, Cambridge, USA, 2023; pp. 1513–1766. doi: 10.1017/9781009157896.013.
Vestas V150-4.2 MW. Available online:
Bamisile, O., Acen, C., Cai, D.S., Huang, Q., Staffell, I. The environmental factors affecting solar photovoltaic output. Renewable and Sustainable Energy Reviews 2025, 208, 115073. doi: 10.1016/j.rser.2024.115073.
Cochran J., Miller, M., Zinaman, O., Milligan, M., Arent, D., Palmintier, B. Flexibility in 21st Century Power Systems, 2014.
Gernaat, D.E.H.J., Bogaart, P.W., Vuuren, D.P., Biemans, H., Niessink, R. High-resolution assessment of global technical and economic hydropower potential. Nature Energy 2017, 2, 821–828. doi: 10.1038/s41560-017-0006-y.
International Renewable Energy Agency, Renewable Energy Statistics 2024, 2024.
International Renewable Energy Agency, Geothermal power: Technology brief, 2017.
Rosenberg, D.M., Bodaly, R.A., Usher, P.J. Environmental and social impacts of large scale hydroelectric development: who is listening? Global Environmental Change 1995, 5, 127–148. doi: 10.1016/0959-3780(95)00018-J.
IEA-ETSAP and IRENA, Biomass for Heat and Power Technology Brief, 2015.
International Energy Agency, Electricity Transmission and Distribution, 2014.
Hitachi Energy, Changji-Guquan UHVDC link. Available online:
National Grid, North Sea Link. Available online:
Independent Electricity System Operator, Looking Back at Blackout 2003. Available:
U.S. Energy Information Administration, Utility-scale batteries and pumped storage return about 80% of the electricity they store. Available online:
Elio, J., Phelan, P., Villalobos, R., Milcarek, R.J. A review of energy storage technologies for demand-side management in industrial facilities. Journal of Clean Production 2021, 307, 127322. doi: 10.1016/j.jclepro.2021.127322.
International Water Power and Dam Construction, Life-span of storage dams. Available online:
Tesla Australia, Megapack – Utility-Scale Energy Storage. Available online:
Lu, B., Stocks, M., Blakers, A., Anderson, K. Geographic information system algorithms to locate prospective sites for pumped hydro energy storage. Applied Energy 2018, 222, 300–312. doi: 10.1016/j.apenergy.2018.03.177.
Hodges, A., Hoang, A.L., Tsekouras, G., Wagner, K., Lee, C.-Y., Swiegers, G.F. A high-performance capillary-fed electrolysis cell promises more cost-competitive renewable hydrogen. Nature Communications 2022, 13, 1304. doi: 10.1038/s41467-022-28953-x.
Martelli, E., Girardi, M., Chiesa, P. Breaking 70% Net Electric Combined Cycle Efficiency With CMC Gas Turbine Blades. In Proceedings of the ASME Turbo Expo 2022: Turbomachinery Technical Conference and Exposition, Rotterdam, Netherlands, June 13–17, 2022. doi: 10.1115/GT2022-81118.
European Association for Storage of Energy, Adiabatic Compressed Air Energy Storage. Available online:
Lu, B., Blakers, A., Stocks, M., Do, T.N. Low-cost, low-emission 100% renewable electricity in Southeast Asia supported by pumped hydro storage. Energy 2021, 236, 121387. doi: 10.1016/j.energy.2021.121387.